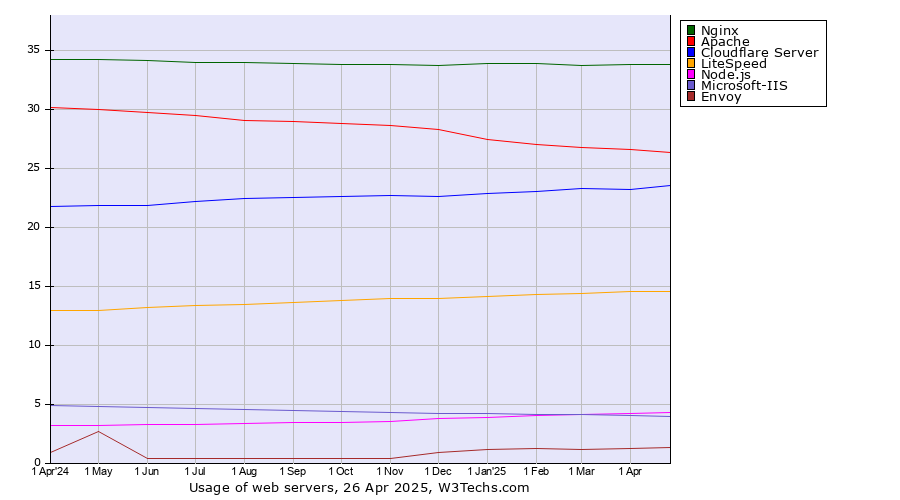
Technologies > Web Servers > Historical Trend > Monthly Historical trends in the usage statistics of web serversThis report shows the historical trends in the usage of the top web servers since April 2023. | 2023
1 Apr | 2023
1 May | 2023
1 Jun | 2023
1 Jul | 2023
1 Aug | 2023
1 Sep | 2023
1 Oct | 2023
1 Nov | 2023
1 Dec | 2024
1 Jan | 2024
1 Feb | 2024
1 Mar | 2024
1 Apr | 2024
20 Apr | | Nginx | 34.5% | 34.4% | 34.4% | 34.2% | 34.5% | 34.3% | 34.2% | 34.2% | 33.8% | 34.1% | 34.1% | 34.1% | 34.2% | 34.2% |
|---|
| Apache | 32.2% | 32.1% | 31.9% | 31.5% | 31.5% | 31.2% | 31.0% | 30.8% | 30.8% | 30.5% | 30.4% | 30.2% | 30.2% | 30.1% |
|---|
| Cloudflare Server | 20.2% | 20.4% | 20.5% | 20.5% | 20.7% | 20.9% | 21.0% | 21.1% | 21.4% | 21.5% | 21.5% | 21.6% | 21.8% | 21.9% |
|---|
| LiteSpeed | 11.8% | 11.8% | 11.9% | 12.0% | 12.3% | 12.4% | 12.5% | 12.6% | 12.8% | 12.9% | 13.0% | 13.2% | 13.0% | 12.9% |
|---|
| Microsoft-IIS | 5.6% | 5.6% | 5.5% | 5.5% | 5.4% | 5.4% | 5.3% | 5.3% | 5.3% | 5.1% | 5.1% | 5.0% | 5.0% | 4.8% |
|---|
| Node.js | 2.4% | 2.4% | 2.5% | 2.5% | 2.6% | 2.7% | 2.9% | 2.9% | 3.0% | 3.0% | 3.1% | 3.1% | 3.2% | 3.2% |
|---|
| Envoy | 0.3% | 0.3% | 0.3% | 1.0% | 0.4% | 0.4% | 0.4% | 0.4% | 0.4% | 0.4% | 0.4% | 0.4% | 1.0% | 2.8% |
|---|
| Google Servers | 0.9% | 0.9% | 0.9% | 0.9% | 0.9% | 0.9% | 0.9% | 0.9% | 0.9% | 0.9% | 0.9% | 0.9% | 0.9% | 0.9% |
|---|
| Caddy | 0.1% | 0.1% | 0.2% | 0.2% | 0.2% | 0.2% | 0.2% | 0.2% | 0.2% | 0.2% | 0.2% | 0.2% | 0.2% | 0.2% |
|---|
| Tengine | 0.1% | 0.1% | 0.1% | 0.1% | 0.1% | 0.1% | 0.1% | 0.1% | 0.1% | 0.1% | 0.1% | 0.1% | 0.1% | 0.1% |
|---|
| IdeaWebServer | 0.1% | 0.1% | 0.1% | 0.1% | 0.1% | 0.1% | 0.1% | 0.1% | 0.1% | 0.1% | 0.1% | 0.1% | 0.1% | 0.1% |
|---|
| Cowboy | 0.1% | 0.1% | 0.1% | 0.1% | 0.1% | 0.1% | 0.1% | 0.1% | 0.1% | 0.1% | 0.1% | 0.1% | 0.1% | 0.1% |
|---|
The diagram shows only web servers with more than 1% usage.
 | Find more details in our extensive web servers market reports. Learn more
|
Share this page |  LinkedIn
 Twitter
 Mastodon
 Bluesky