What can volumes reveal about human brain evolution? A framework for bridging behavioral, histometric, and volumetric perspectives
 Alexandra A. de Sousa
 Michael J. Proulx
- Crossmodal Cognition Lab, Department of Psychology, University of Bath, Bath, UK
An overall relationship between brain size and cognitive ability exists across primates. Can more specific information about neural function be gleaned from cortical area volumes? Numerous studies have found significant relationships between brain structures and behaviors. However, few studies have speculated about brain structure-function relationships from the microanatomical to the macroanatomical level. Here we address this problem in comparative neuroanatomy, where the functional relevance of overall brain size and the sizes of cortical regions have been poorly understood, by considering comparative psychology, with measures of visual acuity and the perception of visual illusions. We outline a model where the macroscopic size (volume or surface area) of a cortical region (such as the primary visual cortex, V1) is related to the microstructure of discrete brain regions. The hypothesis developed here is that an absolutely larger V1 can process more information with greater fidelity due to having more neurons to represent a field of space. This is the first time that the necessary comparative neuroanatomical research at the microstructural level has been brought to bear on the issue. The evidence suggests that as the size of V1 increases: the number of neurons increases, the neuron density decreases, and the density of neuronal connections increases. Thus, we describe how information about gross neuromorphology, using V1 as a model for the study of other cortical areas, may permit interpretations of cortical function.
Background and Purpose
Overall brain size has been found to predict cognitive ability in primates (Deaner et al., 2007; MacLean et al., 2014). A similar trend is apparent from the hominin fossil and archeological records: species mean brain size (estimated from fossil endocrania) increases in concert with evidence for increasingly complex behaviors (de Sousa and Cunha, 2012). Can cortical area volumes reveal more about neural function? The cerebrum is the most enlarged part of the human brain. Within it, cortical areas are functional units which can be defined using several additional criteria (topography, connections, histology, and development) with support from geometric coordinates and sulcal landmarks. The physiological relevance of cortical area volumes is of great interest to evolutionary neuroanatomy. Information about the functional relevance of cortical area volumes is necessary for even the broadest interpretations of cortical function on the basis of hominin fossil endocast shape (de Sousa et al., 2010a). Cortical volumes are increasingly available as tools now assist with or fully automate the parcellation of the cerebral cortex on the basis of histology (Schleicher et al., 1999), gyrification (Destrieux et al., 2010), and connectivity (Johansen-Berg et al., 2004).
Although studies proposing a physiological link between brain structure size and function are numerous, only rarely are mechanisms implicated to explain such links. Numerous studies have suggested evolutionary relationships between the absolute or relative sizes of brain structures and various estimates of social, ecological, and sensory factors (For a review see Healy and Rowe, 2007). Sometimes the links are relatively obscure, with neocortex/brain ratio (Dunbar, 1992) and facial motor nucleus volume (Dobson and Sherwood, 2010) linked to social group size, and neocortex/brain ratio and hippocampus volume linked to executive function (Shultz and Dunbar, 2010). In other cases, the sizes of sensory and motor areas are linked to sensory and motor structures, functions, or opportunities; for example, primary visual cortex size is related to an ecosystem rich in light, as diurnal primates have larger primary visual cortices (V1) than nocturnal ones (Barton, 2006), whereas some ophthalmic subterranean mammals lack any cortex with visual function (Bronchti et al., 2002). Our lack of understanding the meaning of cortical area volumes has led to some criticism of their usage in comparative studies (Roth et al., 2010) and yet these correlative studies continue to link behavior to neuroanatomy in what appears to be a meaningful way. Certainly, there is a functional relationship between brain structure and function, but how is this realized, from the microanatomical to the macroanatomical level?
A larger cortical area has the potential to process more information than a smaller one. Recent work in human neuroimaging suggests that the size of cortical areas may be relevant for making predictions about perceptual experience (Kanai and Rees, 2011). Individual differences in the surface area of V1 correlate with the perceived strength of two size illusions (the Ebbinghaus illusion and a second illusion they called the Ponzo illusion, although their stimuli were more similar to the Corridor illusion, see Figure 1) (Schwarzkopf et al., 2011). Specifically, the individuals experienced a stronger magnitude of the size illusion when the surface area of V1 was smaller.
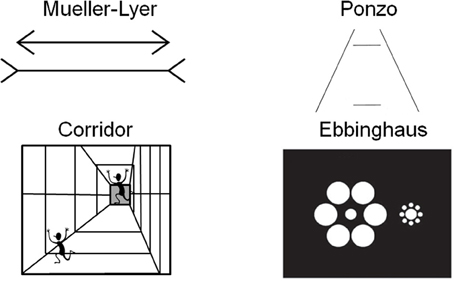
Figure 1. Examples of four size illusions. The two horizontal lines are the same size in the Müller-Lyer and Ponzo illusions. The running person is the same size in each part of the corridor illusion. The central discs are the same size in the Ebbinghaus illusion.
Here we extend this idea to research in comparative neuroanatomy where the functional relevance of overall brain size and the sizes of cortical regions have been poorly understood. We outline how the macroscopic size (weight, volume, or surface area) of a cortical region (such as V1) is related to the microstructure of functional brain regions (Kaas, 2000). Next we provide a framework to test this hypothesis by reviewing published data on V1 and visual behavior. Then we make an initial analysis, bringing together for the first time the available neuroanatomical and behavioral data in extant primate species, despite how sparse these data are due to the challenges of such data collection (Tomasello and Call, 2011). To make the connection between structure and function we first build up from the basic physiological constraints at the level of single neurons, and piece together the evidence to reach the level of cortical area volumes and behavior. Then we move down again from the connection between cortical area size and behavior to uncover the microanatomical correlates of visual acuity and the perception of size illusions. The structure-function relationship we propose was first put forward by Elston et al. (1996) and has been developed in part by others (Kaas, 2000; Kanai and Rees, 2011). However, to our knowledge this is the first time that the necessary comparative neuroanatomical research at the macro- and microstructural levels, along with comparative behavioral data, have been brought to bear on the question.
Linking Microanatomy to Brain Volume
Cortical area size is the label used interchangeably for either surface area, mass, or volume; here we focus on the measure of volume. Volume provides a three-dimensional measure of cortical area size that reflects both the visual field size representation that is primarily mapped by the surface of V1, but also the columnar structure of V1 that includes the feature-specific response properties of receptive fields such as for orientation (Hubel and Wiesel, 1968). Different measures of cortical region size have been shown to have similar structure-function predictive relationships (Kanai and Rees, 2011; Schwarzkopf et al., 2011; de Haas et al., 2012; Lewis et al., 2012). In comparative neuroanatomy, volumetric measurements are common because can they be reliably obtained from histological serial sections more directly than cortical thickness and surface area estimates (Amunts et al., 2007). Volume is a useful measure of cortical region size because the accurate perception of size depends on both the size of the spatial receptive field and the specific representation of visual features such as orientation, and increased volume could afford better processing.
There are biophysical and physiological constraints on the size of functionally-defined cortical areas (Elston et al., 1996). Volumetric or surface area changes in cortical areas indicate an increase in either the size or the number of cells which comprise them. For example, a cortical area might demonstrate a volumetric increase relative to the hypothetical condition of an evolutionary ancestor (Stephan and Andy, 1969; Stephan et al., 1981, 1988). On the one hand, this could be due primarily to a scaling up of neuron size, including a substantial increase in soma volume and an increase in dendrite length. The biophysical properties of the conduction of action potentials make increasing the size of individual neuronal soma less likely. For example, if a neuron's soma were doubled in length its axons and dendrites would also have to double and quadruple in diameter, respectively (Bekkers and Stevens, 1990; Ringo et al., 1994). On the other hand, an increase in the number of neurons may be substantially driving up a structure's volume, in a different way: An increase in neuron number, may be due to the increased biophysical cost of increasing neuronal soma length (Kaas, 2000). This principle has gained insight from recent work demonstrating that for several brain structures, the increase in the mass of that structure across primate species is related to the gaining of neurons. Interestingly, cortical areas gain neurons more quickly than subcortical structures, with V1 gaining neurons faster than the lateral geniculate nucleus and superior colliculus (Collins et al., 2013; Wong et al., 2013).
The volume of V1 in primates ranges from 0.14 cm3 in a ~54 g lesser mouse lemur to 15.24 cm3 in a ~65,000 g human (de Sousa et al., 2010a). The size of a cortical region is related to body size in so far as brain mass increases with body mass (Jerison, 1955) and cortical region volumes scale to brain volume (Finlay and Darlington, 1995). Also the size of the eye is related to body size, and eye size is also related to V1 size (Stephan et al., 1984; Andrews et al., 1997; Stevens, 2001). It is interesting to note that larger eyes have greater visual resolution than smaller ones (Archer et al., 1999). However, here we suggest why deviations from scaling to such gross variables might occur. The amount of visual cortex required is dependent on the amount of visual input. Our hypothesis focuses instead on how V1 size may be a constraint on image processing. We suggest that, for a given image, the degree of detail which can be represented neurally is dependent on the size of the visual cortex. In primate species, the entire visual field is purportedly mapped retinotopically in V1 (Hubel and Wiesel, 1968) and individual neurons can be examined as having functional specializations related to regions of space, visual features, and other computations (Barlow, 1972). Based on recent work by Collins et al. (2013) larger V1s have more neurons (calculated from their sample, n = 6 primates, the least squares slope is 0.8815). Here we approximate this trend for a diverse primate sample (Figure 2; Table 1). Therefore, if visual field size remains constant, the proportion of the visual field that each neuron codes for decreases. Even with changes in visual field size, an increase in neuron number would suggest that each neuron is responsible for a decreased proportion of the visual field. In contrast, given fewer neurons in a smaller V1, each neuron is responsible for coding a greater number of degrees of visual angle of the visual field (see Figure 3).
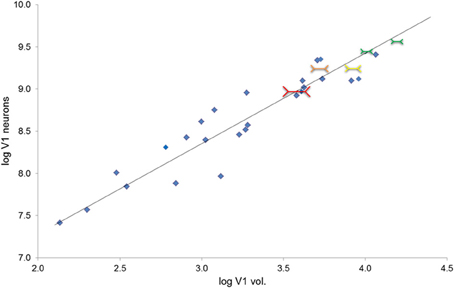
Figure 2. Total number of V1 neurons increase as a function of V1 volume (r28 = 0.95); the plot also provides the reduced major axis (RMA) regression of the base 10 logged species mean data (y = 1.073x + 5.134, R2 = 0.899, p < 0.001). Total neuron number estimated from V1 layer II–VI neuron density times V1 volume in mm3 (gray matter only, Frahm et al., 1984; Bush and Allman, 2004; de Sousa et al., 2010a; Lewitus et al., 2012b). (Note that because layer I was not included in the neuron density estimate, these should be considered to be overestimates of total V1 neuron number, but this overestimation is consistent for the whole sample). This figure also depicts visual illusion strength in the context of V1 volume and neuron numbers. Red shows the greatest size illusion experience, followed by orange, yellow, and green as the weakest size illusion experience; the size of the colored Müller-Lyer data points also corresponds to the size of the illusion experience (greater to weakest).
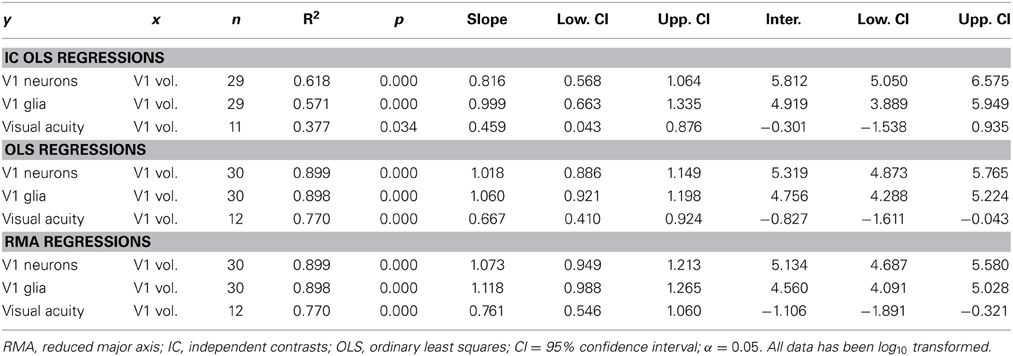
Table 1. Regressions of number of V1 neurons, number of V1 glia, and maximum visual acuity on V1 (gray matter) volume.
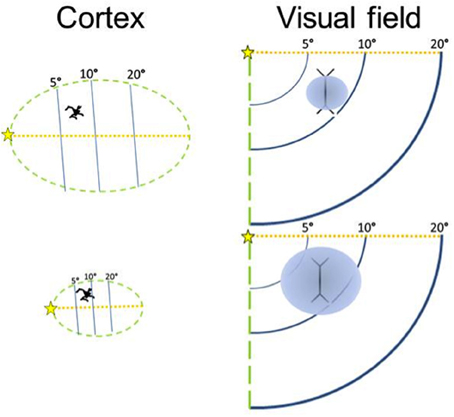
Figure 3. The size of the visual field represented by a neuron is inversely related to the size of the cortical region. A larger cortical area has more neurons, although neuronal soma size does not increase much. Modified from Elston et al. (1996).
Therefore, the size of a cortical area appears to be inversely related to the proportion of the visual field covered by each of its neurons' dendritic arbors, suggesting that in small areas each neuron takes on a large share of the network (Elston et al., 1996; Elston and Rosa, 1998). It is now well known that a V1 neuron's classic receptive field (the response properties of a neuron, including the region of the visual field for which it codes) is influenced by its lateral interactions with other neurons (Allman et al., 1985a,b).
As V1 increases in volume, dendritic length changes relatively little (Lund et al., 1993; Lyon et al., 1998), so we expect that the proportion of the visual field in which lateral interactions influence the activity of a neuron becomes relatively smaller (Figure 3). This is because the dendrites are not long enough to connect with more distant neurons that represent areas of the visual field that now have a more distant cortical representation in a larger V1. Across the cerebral cortex, the lateral spread of dendrites ranges only by about a factor of two (Lund et al., 1993). Neurons in large areas do not have larger dendritic arbors than neurons in small areas (Tyler et al., 1998), and in fact, the converse is at least sometimes the case, with some smaller cortical areas having neurons with larger dendritic arbors (Elston et al., 1996; Elston and Rosa, 1998). Dendritic length is unlikely to be the main cause of differences in cortical area size across species, either. Crucially, although neurons in the small tree shrew's V1 (surface area = 120 mm2) project to over half of its V1 surface, in the larger macaque V1 (surface area = 1200 mm2), the neurons project to a relatively smaller region (Rockland and Lund, 1983; Lund et al., 1993).
Note that the size and number of cells other than neurons contribute to cortical area volume. These cells play a supportive role to neurons and their scaling reflects this. We find that glia increase in number with V1 volume (y = 1.118x − 4.560, R2 = 0.898, r28 = 0.95, p < 0.001, two-tailed; Table 1). Similarly, Collins and colleagues reported that cells other than neurons (mostly glia) increase in number in concert with neurons, and in near-linearity with V1 mass (Collins et al., 2013). This is in accordance with the ratio of glia to neurons remaining constant in V1, and not increasing with brain size in primates (Lewitus et al., 2012a).
Comparative Behavioral Data
If neurons in a larger V1 provide a more detailed representation of visual space, then changes in the size of V1 should have functional correlates. As a metaphor for these differing representations, consider the number of pixels coding a digital image. A smaller V1 would have fewer pixels to represent an image, and each pixel would sample across a wider context to reach its value. A larger V1 would have more pixels to represent an image, and thus each pixel would provide the value for a small area of space and would not be as influenced by context. V1 volume in particular would also allow for the more accurate coding of feature information in each pixel, such as orientation, again allowing for a more accurate representation of the information in a pixel that would be less influenced by context. This metaphor suggests two potential measures of function: size perception and visual acuity.
The influence of context on perception can be assessed through the use of geometrical illusions. There is a class of visual illusions in which context (i.e., the surrounding background features) affects the perception of the size of an object. Classic size illusions include the Ponzo and Müller-Lyer illusions (see Figure 1). These illusions use the addition of “irrelevant” surrounding spatial information, such as flanking lines, to influence the size perception of the central, “relevant” lines that are tested. The structure of the brain, specifically in this case the size of V1, should have functional implications for processing such stimuli. Indeed this has been demonstrated in humans using measurements of surface area and volume acquired by magnetic resonance imaging (Schwarzkopf et al., 2011). Area V1 is a likely correlate of size perception because the receptive field properties of its neurons code for oriented lines in discrete spatial locations with a retinotopic organization (Hubel and Wiesel, 1968; Schwartz et al., 2002). Higher order areas instead code for more complex combinations of features in larger receptive fields (Gottlieb et al., 1998). Moreover, because the perception of the illusion occurs across the visual field at small spatial scales, other higher order areas (such as inferotemporal cortex) would be unlikely, as would areas that precede V1 in sensory processing such as pre-chiasmatic cells due to their simpler processing and uni-laterality in terms of only processing part of the visual field. This hierarchical organization—in which simple features are processed in primary sensory areas and more complex combinations of features are processed in higher order areas—has been demonstrated by neurophysiological studies and behavioral studies of perception and perceptual learning (for a review see Proulx et al., 2014).
Here we assessed whether V1 volume and visual perception in primates are consistent with the model we have outlined that relates neural structure and function. Primates provide an optimal assessment of the microanatomical, macroanatomical, and psychological aspects of this model due to the convergence of comparative behavioral data (Segall et al., 1963; Fujita et al., 1991; Fujita, 1997; Nakamura et al., 2006; Barbet and Fagot, 2007; Suganuma et al., 2007; Imura et al., 2008; Parron et al., 2008; Pepperberg et al., 2008; Tudusciuc and Nieder, 2010; Schwarzkopf et al., 2011), gross neuroanatomical data and micro-neuroanatomical data (Frahm et al., 1984; Bush and Allman, 2004; de Sousa et al., 2010a; Lewitus et al., 2012b).
We reviewed studies of visual illusion perception in primates to compile quantitative data for comparison of illusion magnitude and V1 volume. We performed a literature search for articles reporting size illusion data in non-human animals. Table 2 displays those studies and size illusions that were found, and also notes those that were suitable due to the reporting of quantitative data that could be used to calculate illusion strength (some studies only presented a qualitative result and therefore were not suitable for the analysis here). A large human literature exists, and a representative cross-cultural study was chosen to represent humans in addition to the human data present in the articles that compared humans with non-human animals. Some size illusions have been under investigation for over 100 years (Müller-Lyer, 1889), and the methods for their study are well-established and similar across the species shown in Table 2. The quantitative magnitude of the size illusion was taken as the percentage difference in the perception of object size caused by the illusion manipulation. The magnitude of the size illusion was expressed in many articles as a percentage difference in object size which was derived from the points of subjective equality on the psychophysical functions. The point of subjective equality indicates the perceived size of the object (manipulated by a size illusion) in comparison to another object when the viewer reports the two to be the same size, when in fact one is larger than the other. If this information was not reported, then the authors were contacted and those authors provided this data upon request. Volumes of V1 for the matching anthropoid species (or where not available, genus) were taken from published datasets (Frahm et al., 1984; Bush and Allman, 2004; de Sousa et al., 2010a; Lewitus et al., 2012b).
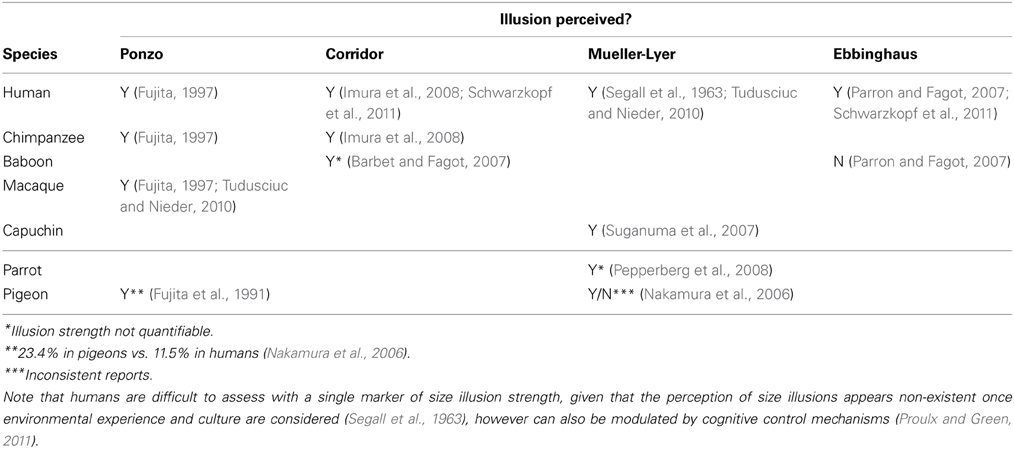
Table 2. Comparative behavioral data on the perception of visual illusions by primate and avian species.
We also investigated the relationship between visual acuity and V1 volume in primates. Data were obtained from the literature for visual acuity (Kirk and Kay, 2004) and primary visual cortex volume (Frahm et al., 1984; Bush and Allman, 2004; de Sousa et al., 2010a; Lewitus et al., 2012b). For this sample, data were available for both diurnal and nocturnal primate species, which were plotted separately.
Linking Brain Volume to Behavior
We examined the number of V1 neurons as a function of V1 volume in primates (data from: de Sousa et al., 2010a; Lewitus et al., 2012b). As shown in Figure 2, the total number of neurons in V1 increases as a function of V1 volume (r28 = 0.95; least squares regression of the logged species mean data, y = 1.073x + 5.134, R2 = 0.899, p < 0.001). Figure 2 also depicts the relationship between V1 volume and visual illusion strength in the context of the relationship between V1 volume and neuron numbers. V1 size appears to be related to visual perception across primate genera; this is due to a negative correlation between the logarithm of V1 volume and illusion strength (r3 = −0.71; not shown in the figure). This result parallels a study of human inter-individual differences in illusion strength and V1 surface area (Schwarzkopf et al., 2011). The data are consistent with the proximate model outlined above and suggest that anthropoid genera with larger V1 volumes have a weaker experience of size illusions. Consistent with the within-species data for illusion strength and V1 surface area previously reported for humans (Schwarzkopf et al., 2011), V1 size appears to be related to visual perception even at the level of genera across primates.
Might this trend extend beyond anthropoids to include other taxa, such as birds (Fujita et al., 1991; Nakamura et al., 2006, 2009a,b)? The Wulst of the pigeon (187.43 mm3 in volume) contains the primary visual area (plus the much smaller primary somatosensory area) and is certainly much smaller in size than human V1 (Jarvis et al., 2005; Reiner et al., 2005; Iwaniuk et al., 2008). In a comparative test of the Ponzo illusion it was found that the pigeon experienced the illusion more strongly (23.4%) than humans (11.5%), consistent with the trend shown in anthropoids (Fujita et al., 1991), and with individual differences in humans (Kanai and Rees, 2011). Although size illusions have not been assessed in larger bird species, it is worth noting that visual acuity has been assessed for a number of birds both anatomically and behaviorally. Visual acuity increases as a function of body and brain mass in birds (Kiltie, 2000), with large birds of prey such as falcons having particularly high acuity (Fox et al., 1976).
Visual acuity also increases with V1 volume in primates. Although vision may have an increased effect on brain size scaling with increased chromacy (Barton, 1998), this trend can be seen in Figure 4 with nocturnal and diurnal primates (y = 0.761x − 1.106, R2 = 0.770, r10 = 0.88, p < 0.001, two-tailed). Figure 4 also illustrates how diurnal primates, with the exception of the ring-tailed lemur, all have greater visual acuity than nocturnal primates, and diurnal primates, with the exception of the common marmoset, all have greater V1 volume than nocturnal primates.
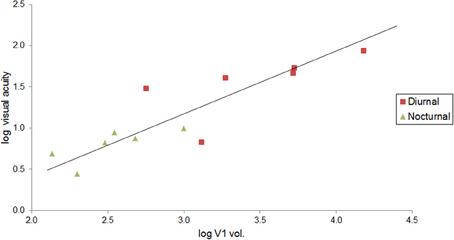
Figure 4. Visual acuity increases as a function of V1 volume in both diurnal and nocturnal primates. Log-log (base 10) RMA plot of V1 volume (mm3, as above: Frahm et al., 1984; Bush and Allman, 2004; de Sousa et al., 2010a; Lewitus et al., 2012b) as a function of visual acuity (y = 0.761x − 1.106, R2 = 0.770, p < 0.001). The species' visual acuity was estimated based on the maximum visual acuity value (c/deg) out of all values listed for behavioral and anatomical visual acuity (Kirk and Kay, 2004).
Linking Behavior to Microanatomy to Brain Volume
The negative correlation between primary visual area size and size illusion magnitude appears to hold not only for humans, but also across other anthropoids (and potentially birds as well). The positive correlation between primary visual area size and visual acuity converges with these results to suggest the brain volume has implications for function. The microanatomical basis of this relationship can be examined in further detail with additional comparative research.
A key aspect of the model which can be assessed using neuroanatomical data is the perceptual correlate of increasing the number of neurons per degree of the visual angle. Across mammals, larger brains have fewer neurons per unit volume (Tower, 1954). Similarly, across anthropoids, V1 neuron density decreases with brain size (Sherwood et al., 2007). However, V1 volume increases with brain volume at a rate which outpaces the decrease in cortical neuron numerical density. Therefore, we show here that as V1 increases in volume, V1 total neuron number also increases substantially (Figure 2).
When there are functional demands specific to different modules, brain structures may evolve as part of functionally defined modules in a mosaic fashion (Barton and Harvey, 2000), although any changes in brain organization are likely to occur in a similar manner even in distantly related species (Krubitzer and Seelke, 2012). A cortical area under strong selective pressure (such as V1) might exhibit reorganization at both the micro- and macro-anatomical levels. The relationship between microanatomy and macroanatomy would be greatest within a group of brain regions linked by a common modality; such areas would deviate from overall brain scaling trends while remaining similar to each other. In support of this, in a group of higher primates, visual area neuronal volume densities (measured as the Gray Level Index, GLI) scale specifically with the sizes of visual structures, but do not scale with unrelated changes in brain size (de Sousa et al., 2010b). Further, within humans, there is a great deal of intraspecific variability in V1 volume [varying by a factor of up to 3; (Andrews et al., 1997)], something also seen in apes (de Sousa et al., 2010a). However, this variation is specific to the visual system and there is strong correspondence between the sizes of different visual brain structures [V1, LGN, and optic tract; (Andrews et al., 1997)].
Given the negative relationship between brain volume and neuron numerical density, in larger brains neuronal soma are more sparsely distributed, as cortical tissue is increasingly comprised of space for connections (Sherwood and Hof, 2007; Semendeferi et al., 2011; Teffer et al., 2013). Thus a larger V1 has more neurons, yet the lower density also suggests it has less cortical tissue per unit volume occupied by neuronal soma, and more cortical tissue per unit volume available for interneuronal connections (de Sousa et al., 2010b). During development, an increase in neuropil coincides with increased cortical connectivity (Eayrs and Goodhead, 1959; Cragg, 1975). The increased neuropil (and connections) may afford greater neuroplasticity and behavioral plasticity, either by enabling synaptic pruning or alternatively by reflecting new connections (Rauschecker, 1991; Anurova et al., 2014). Plentiful connections might give rise to greater behavioral flexibility more directly, such as the development of a saliency, or attention, map in V1 formed by connections between layer II-III pyramidal cells (Li, 2002).
Functional Utility of Illusions
In the case of so-called “illusions” a representation of an object is distorted due to the influence of context. A number of theories propose that visual perception is more accurate when illusion strength is relatively low (Kanai and Rees, 2011; Schwarzkopf et al., 2011). Although this might be true within the confines of a psychophysical task, this perspective might not generalize to perception outside the laboratory where evolutionary pressures led to the neuroanatomical variability present among anthropoids.
At this point we can only speculate about the ecological significance of illusions. The perception of illusions may not be errors, per se, and might in fact convey an evolutionary advantage. Possibly, they make for simpler processing of complex stimuli. Faster or simpler perception of stimuli might initiate reflexive motor responses or facilitate decision making (Proulx and Green, 2011) driven by attentional maps in areas such as V1 (Li, 2002). Similarly, in some cases poor visual acuity might be preferred over high visual acuity. Even within the visual field of humans, only the center of focus provides high visual acuity due to the density of cone cells in the fovea of the retina. Peripheral vision is conveyed by rod cells that are less dense. Yet information processing of peripheral information is sufficient for successful navigation and obstacle avoidance in an automatic fashion that does not tax attentional resources.
Further, illusions reveal the influence of the context, rather than purely local information, on perception (Gregory, 1968). The perception of a feature such as size might be influenced by one's goal, such as with the size-weight illusion and the consideration of objects for throwing (Zhu and Bingham, 2011). The most straightforward conclusion relating V1 size to the size perception is that an increase in cortical area size diminishes the role of context on size perception. Even though humans have a larger absolute V1 than other species, they are still susceptible to illusions and even prioritize size on the basis of these illusions, suggesting that the context might be valued for rapid information processing. For example, contextual information provided by illusions initiates a reflexive response which occurs in the absence of awareness (Moore and Egeth, 1997). Also, size generated by the Müller-Lyer illusion can capture attention more strongly than standard size (Proulx and Green, 2011). But, the relatively low illusory strength in humans could indicate that humans process visual stimuli more slowly than many other species.
Cross-culturally in humans, there have been reports that the perception of size illusions appears non-existent once environmental experience and culture are considered, as with extant hunger-gatherer societies (Segall et al., 1963). Although compelling, later work found that the results may have underestimated the perception of size illusions due to a methodological issue; attention to the size illusion stimuli was modulated by cognitive control mechanisms (Gardner, 1961; Davis and Segall, 1971). This suggests a certain degree of perceptual flexibility that big brains might afford. The perception of size and illusions is not always compulsory because cognitive control can modulate the effects of context such that top-down attention can enhance or diminish the influence of context (Gardner, 1961; Davis and Segall, 1971). One way to resolve the problem of whether illusions are errors or not is that perhaps a level of behavioral flexibility is a marker of a larger cortical area, such that context is no longer processed reflexively, but can instead be used or ignored as a function of current goals of an animal such as the primates examined here. This flexibility arises as a function of two further clues to the relation between structure and function in neural basis of size perception: the potential increase in connections between neurons in V1 as it is increased and the flexible role of attention that can take advantage of this scaffolding (Chittka and Niven, 2009).
Constraint and Adaptation in the Evolution of Brain Structures
Our model proposes that there are functional consequences of changes in the absolute sizes of individual topographically-defined brain regions, and thus has implications for the constraints and adaptive pressures involved in the evolution of brain structures. Across mammals, the sizes of individual brain structures are highly linked to total brain volume (Finlay and Darlington, 1995) and there is a relationship between neuron number and brain volume (Haug, 1987). Although brain size can be linked to general aspects of behavior and brain organization, there remain open questions about whether it is relative or absolute brain structure size that is important and how constraints and adaptive processes influence brain organization.
First, there is the issue of relative vs. absolute brain size. V1 volume is the most dramatically reduced cortical area in modern humans (relative to brain size) (de Sousa et al., 2010a). Anthropologists have long debated whether that the relative reduction in V1 volume is linked to overall brain size (Jerison, 1975), or rather due to functionally-relevant expansion of higher order visual and multisensory cortex (Dart, 1925). In fact, human absolute V1 volume is larger than or similar to that of their closest relatives, the chimpanzees and bonobos (de Sousa et al., 2010a). Therefore, for V1, absolute volume might be more informative about visual function than relative volume. Unlike absolute V1 volume, a relative measure of V1 size according to overall brain size does not appear to have the same consistent relationship with illusion strength. These results support the hypothesis that the evolution of particular functional brain regions might be more important for understanding human brain evolution.
Second, the volume of the entire brain is constrained due to its high metabolic costs (Fonseca-Azevedo and Herculano-Houzel, 2012), but energy requirements vary among brain regions (Karbowski, 2007). Therefore, there may be an additional interaction between a given brain region's metabolic cost and the functional relevance of its size. Where there are additional selective pressures to maintain an optimal size, brain structure size might not merely need to keep pace with brain size scaling.
Third, cortical region axis location influences neuron size and number. Our model is based on V1, which is perhaps the largest cortical area in higher primates (Felleman and Van Essen, 1991)—but the brain is not a homogenous tissue and variations exist across cortical zones (Herculano-Houzel et al., 2013). From lower to higher order visual areas, neurons have increasingly large receptive fields; and in crossmodal areas receptive fields bring together multiple sensory maps. Scaling relationships are not identical across the cortex, and moving along a caudal rostral axis in particular cortical areas follow a gradient in neuronal density (Collins et al., 2010) and dendrite complexity (Elston et al., 2009, 2011; Manger et al., 2013).
Fourth, phylogeny is another important influence on neuron number and size. Different mammalian clades show different specific positive scaling relationships between neuron number and brain weight (Herculano-Houzel, 2012; Neves et al., 2014) and neuronal soma volume and brain volume (Haug, 1987; Sherwood et al., 2003; Elston and Manger, 2014).
Neuroanatomical Basis for Perception and Attention in V1
Computational models of how attention can prioritize the information processing of salient objects in the visual environment build upon the anatomical structure of V1. Our model builds on the work of Elston et al. (1996) who have focused on V1 differences between taxa in layer III pyramidal cells as the specific cells represented in our model in Figure 3. The coding of space has implications for not only perception, as indicated by the acuity and size illusion data reviewed here, but also for attention, the cognitive mechanism of selecting information in primary sensory areas for further processing in higher order areas. On the computational modeling side, work by Zhaoping Li and colleagues (Li, 2002) on the development of a saliency, or attention, map in V1 focuses on the same layer II–III pyramidal cells studied by Elston because these cells are the crucial link to provide contextual modulation of neural activity that represents other portions of the visual field. For example, behavioral evidence has shown that illusory size receives enhanced attentional processing (Proulx and Green, 2011). One hypothesis is that these pyramidal cells in V1 might be a specific link between micro- and macro-structure in comparative neuroanatomy and psychology.
Implications for the Hominin Fossil Record
The examination of brain structure in primates and understanding its link to perceptual function can provide insight into the evolution of human cognition and consciousness. Brain size has increased throughout human evolution. Although brain size has traditionally been linked to enhanced cognitive function, the hominin fossil and archeological records have documented cognitive advancements, such as tool use, that have preceded major changes in brain size (de Sousa and Cunha, 2012). The suggestion that brain reorganization occurred in early hominins prior to brain size expansion dates to Dart's (1925) description of the Taung juvenile Australopithecus africanus endocast—the first australopith ever discovered—and the question of whether brain size and brain organization can evolve independently has had important implications for paleoanthropology. Here the comparative data demonstrate why changes in the sizes of brain structures early in hominin evolution may be functionally relevant.
V1 size does differ within and between extant primate species, however nothing had been known about the implications or causes of V1 size variation between closely related hominin species, for which the link between brain size, brain organization, and brain function remains obscure. This first piece of evidence for constraints and adaptive pressure in the evolution of the hominin brain arose from the location of the lunate sulcus, a marker of the anterior limit of V1 in non-human higher primates. Although the A. africanus described by Dart had an ape-like brain size, the lunate sulcus was said to be in a posterior location (a more reliable assessment has been made on a newer discovery; see Holloway et al., 2004). This indicated a smaller V1 and thus a greater proportion of cortex that could be devoted potentially to higher level cognition. Similarly, a recent fossil hominin, Homo floresiensis, has an ape-size endocranial volume (426 cm3; Kubo et al., 2013) but is associated with modern-like brain organization including a posteriorly positioned lunate sulcus, and surprisingly sophisticated tools (Morwood et al., 2004). Further, large endocranial volumes are known for modern humans (range 1090–1880 cm3) and Neanderthals (range 1172–1740 cm3) (de Sousa and Cunha, 2012), but it has been suggested that they could have differed in functionally-relevant brain organization. Modern humans, compared to Neanderthals, are estimated to have a slight, statistically insignificant decrease in occipital lobe volume (Balzeau et al., 2012) and based on their smaller orbit size, a decrease in the size of striate and extrastriate areas has been suggested (Pearce et al., 2013). The model here suggests that perhaps changes at the sensory level create the necessary advantages in neural processing that allow for increasingly complex behaviors, followed by a later expansion of higher-level associative areas only possible once the benefits of such behavioral innovations, such as tool use, arise.
The study of extant species provides the tantalizing hypothesis that the reconstruction of the evolution of the brain through endocasts holds the possibility to reveal how fossil hominins saw the world, perhaps despite the pessimism held by some: “It might be interesting to know how cognition (whatever that is) arose and spread and changed, but we cannot know. Tough luck” (Lewontin, 1998).
Initial Clues and Remaining Questions
The comparative psychological and neuroanatomical data available are consistent with a model that relates primary visual cortex size to visual acuity and the perception of visual illusions. An increase in the size of V1 begets a decrease in the magnitude of the perception of size illusions (Kanai and Rees, 2011). Here we report that overall the neuron volume density decreases with brain size in higher primates. This indicates that as brains get bigger, less space is devoted to neuronal soma and there is more space for connections. This suggests that as the size of V1 increases, the number of neurons increases. Thus a larger absolute V1 can provide the basis for lower illusion strength due to having more neurons to represent a field of space.
Future comparative studies of sensory information processing could be quantified to more easily permit comparisons across species (rather than just testing qualitatively whether the animals can do the task). The mechanism in question might be investigated in further studies which incorporate information about neural circuits (e.g., dendritic arborization, synaptic density), a topic which is revealing itself to be surprisingly complex (Elston et al., 2009).
Does the relationship hold across all species in general, and within primates in particular? Clearly the current literature provides scant data for a full examination of that question. More comparative studies of visual illusions in non-human animals paired with investigations of comparative neuroanatomy can shed light on our understanding of structural and functional relationships and on the evolution of cognition (Emery and Clayton, 2005; de Sousa et al., 2010b; Tomasello and Call, 2011; MacLean et al., 2012).
Importantly there are many novel questions arising from this study that such a research initiative can address. For example, there are many other illusions that are used to assess conscious perception in human and non-human animals and the potential neural basis for these are of great importance as well. A recent study examined illusory size perception in the experience of after images, and found that V1 activity corresponded to perceived size rather than retinal size (Sperandio et al., 2012). Certainly this model need not be restricted to vision, either. The primary auditory and somatosensory cortices can also be assessed through comparative psychological and neuroanatomical studies as well. Given the recent findings that compare visual to auditory neuron numbers and area mass in non-hominid primates (Collins et al., 2013; Wong et al., 2013), it would be interesting to examine neuronal size, neuron density, and area mass, volume, and surface area for such future studies. The approach of the model presented here is most relevant for assessing functional changes in sensory, rather than association areas. For example, the addition of novel association areas seems to be another way that brains expand in size and diversify in function (Kaas, 1989, 2000; Kaas et al., 2013). However, although the details would be harder to examine, even high level multisensory areas, such as those in the superior temporal sulcus and posterior parietal cortex (Pasqualotto and Proulx, 2012; Proulx et al., 2014), are involved in multisensory illusions (McGurk and MacDonald, 1976) and cortical size could reflect this. This bottom-up approach to understanding brain evolution, that is from a sensory and perceptual perspective rather than a top-down or high-level cognitive and linguistic perspective, might yield the sorts of findings that have hitherto been overlooked in the investigation of cognitive evolution and the origins of consciousness (Humphrey, 2011; Proulx, 2011).
Conflict of Interest Statement
The authors declare that the research was conducted in the absence of any commercial or financial relationships that could be construed as a potential conflict of interest.
References
Allman, J., Miezin, F., and McGuinness, E. (1985a). Direction- and velocity-specific responses from beyond the classical receptive field in the middle temporal visual area (MT). Perception 14, 105–126. doi: 10.1068/p140105
Allman, J., Miezin, F., and McGuinness, E. (1985b). Stimulus specific responses from beyond the classical receptive field: neurophysiological mechanisms for local-global comparisons in visual neurons. Annu. Rev. Neurosci. 8, 407–430. doi: 10.1146/annurev.ne.08.030185.002203
Amunts, K., Armstrong, E., Malikovic, A., Homke, L., Mohlberg, H., Schleicher, A., et al. (2007). Gender-specific left-right asymmetries in human visual cortex. J. Neurosci. 27, 1356–1364. doi: 10.1523/JNEUROSCI.4753-06.2007
Andrews, T. J., Halpern, S. D., and Purves, D. (1997). Correlated size variations in human visual cortex, lateral geniculate nucleus, and optic tract. J. Neurosci. 17, 2859–2868.
Anurova, I., Renier, L. A., De Volder, A. G., Carlson, S., and Rauschecker, J. P. (2014). Relationship between cortical thickness and functional activation in the early blind. Cereb. Cortex. doi: 10.1093/cercor/bhu009. [Epub ahead of print].
Archer, S. N., Djamgoz, M. B. A., Loew, E., Partridge, J. C., and Vallerga, S. (1999). Adaptive Mechanisms in the Ecology of Vision. Dordrecht: Kluwer.
Balzeau, A., Holloway, R. L., and Grimaud-Herve, D. (2012). Variations and asymmetries in regional brain surface in the genus Homo. J. Hum. Evol. 62, 696–706. doi: 10.1016/j.jhevol.2012.03.007
Barbet, I., and Fagot, J. (2007). Control of the corridor illusion in baboons (Papio papio) by gradient and linear-perspective depth cues. Perception 36, 391–402. doi: 10.1068/p5108
Barlow, H. (1972). Single units and sensation: a neuron doctrine for perceptual psychology? Perception 1, 371–394. doi: 10.1068/p010371
Barton, R. A. (1998). Visual specialization and brain evolution in primates. Proc. Biol. Sci. 265, 1933–1937. doi: 10.1098/rspb.1998.0523
Barton, R. A. (2006). Olfactory evolution and behavioral ecology in primates. Am. J. Primatol. 68, 545–558. doi: 10.1002/ajp.20251
Barton, R. A., and Harvey, P. H. (2000). Mosaic evolution of brain structure in mammals. Nature 405, 1055–1058. doi: 10.1038/35016580
Bekkers, J. M., and Stevens, C. F. (1990). Two different ways evolution makes neurons larger. Prog. Brain Res. 83, 37–45. doi: 10.1016/S0079-6123(08)61239-X
Bronchti, G., Heil, P., Sadka, R., Hess, A., Scheich, H., and Wollberg, Z. (2002). Auditory activation of ‘visual’ cortical areas in the blind mole rat (Spalax ehrenbergi). Eur. J. Neurosci. 16, 311–329. doi: 10.1046/j.1460-9568.2002.02063.x
Bush, E. C., and Allman, J. M. (2004). Three-dimensional structure and evolution of primate primary visual cortex. Anat. Rec. A Discov. Mol. Cell. Evol. Biol. 281, 1088–1094. doi: 10.1002/ar.a.20114
Chittka, L., and Niven, J. (2009). Are bigger brains better? Curr. Biol. 19, R995–R1008. doi: 10.1016/j.cub.2009.08.023
Collins, C. E., Airey, D. C., Young, N. A., Leitch, D. B., and Kaas, J. H. (2010). Neuron densities vary across and within cortical areas in primates. Proc. Natl. Acad. Sci. U.S.A. 107, 15927–15932. doi: 10.1073/pnas.1010356107
Collins, C. E., Leitch, D. B., Wong, P., Kaas, J. H., and Herculano-Houzel, S. (2013). Faster scaling of visual neurons in cortical areas relative to subcortical structures in non-human primate brains. Brain Struct. Funct. 218, 805–816. doi: 10.1007/s00429-012-0430-5
Cragg, B. G. (1975). The development of synapses in the visual system of the cat. J. Comp. Neurol. 160, 147–166. doi: 10.1002/cne.901600202
Dart, R. A. (1925). Australopithecus africanus: the Man-Ape of South Africa. Nature 115, 195–199. doi: 10.1038/115195a0
Davis, C. M., and Segall, M. H. (1971). Effect of relative positions of segments on strength of the Mueller-Lyer illusion. Percept. Mot. Skills 33, 1051–1058. doi: 10.2466/pms.1971.33.3f.1051
Deaner, R. O., Isler, K., Burkart, J., and van Schaik, C. (2007). Overall brain size, and not encephalization quotient, best predicts cognitive ability across non-human primates. Brain Behav. Evol. 70, 115–124. doi: 10.1159/000102973
de Haas, B., Kanai, R., Jalkanen, L., and Rees, G. (2012). Grey matter volume in early human visual cortex predicts proneness to the sound-induced flash illusion. Proc. Biol. Sci. 279, 4955–4961. doi: 10.1098/rspb.2012.2132
de Sousa, A., and Cunha, E. (2012). Hominins and the emergence of the modern human brain. Prog. Brain Res. 195, 293–322. doi: 10.1016/B978-0-444-53860-4.00014-3
de Sousa, A. A., Sherwood, C. C., Mohlberg, H., Amunts, K., Schleicher, A., MacLeod, C. E., et al. (2010a). Hominoid visual brain structure volumes and the position of the lunate sulcus. J. Hum. Evol. 58, 281–292. doi: 10.1016/j.jhevol.2009.11.011
de Sousa, A. A., Sherwood, C. C., Schleicher, A., Amunts, K., MacLeod, C. E., Hof, P. R., et al. (2010b). Comparative cytoarchitectural analyses of striate and extrastriate areas in hominoids. Cereb. Cortex 20, 966–981. doi: 10.1093/cercor/bhp158
Destrieux, C., Fischl, B., Dale, A., and Halgren, E. (2010). Automatic parcellation of human cortical gyri and sulci using standard anatomical nomenclature. Neuroimage 53, 1–15. doi: 10.1016/j.neuroimage.2010.06.010
Dobson, S. D., and Sherwood, C. C. (2010). Correlated evolution of brain regions involved in producing and processing facial expressions in anthropoid primates. Biol. Lett. 7, 86–88. doi: 10.1098/rsbl.2010.0427
Dunbar, R. I. M. (1992). Neocortex size as a constraint on group-size in primates. J. Hum. Evol. 22, 469–493. doi: 10.1016/0047-2484(92)90081-J
Eayrs, J. T., and Goodhead, B. (1959). Postnatal development of the cerebral cortex in the rat. J. Anat. 93, 385–402.
Elston, G. N., Benavides-Piccione, R., Elston, A., Manger, P. R., and Defelipe, J. (2011). Pyramidal cells in prefrontal cortex of primates: marked differences in neuronal structure among species. Front. Neuroanat. 5:2. doi: 10.3389/fnana.2011.00002
Elston, G. N., and Manger, P. (2014). Pyramidal cells in V1 of African rodents are bigger, more branched and more spiny than those in primates. Front. Neuroanat. 8:4. doi: 10.3389/fnana.2014.00004
Elston, G. N., Oga, T., and Fujita, I. (2009). Spinogenesis and pruning scales across functional hierarchies. J. Neurosci. 29, 3271–3275. doi: 10.1523/JNEUROSCI.5216-08.2009
Elston, G. N., and Rosa, M. G. (1998). Morphological variation of layer III pyramidal neurones in the occipitotemporal pathway of the macaque monkey visual cortex. Cereb. Cortex 8, 278–294. doi: 10.1093/cercor/8.3.278
Elston, G. N., Rosa, M. G. P., and Calord, M. B. (1996). Comparison of dendritic fields of layer III pyramidal neurons in striate and extrastriate visual areas of the marmoset: a lucifer yellow intracellular injection study. Cereb. Cortex 6, 807–813. doi: 10.1093/cercor/6.6.807
Emery, N. J., and Clayton, N. S. (2005). Evolution of the avian brain and intelligence. Curr. Biol. 15, R946–R950. doi: 10.1016/j.cub.2005.11.029
Felleman, D. J., and Van Essen, D. C. (1991). Distributed hierarchical processing in the primate cerebral cortex. Cereb. Cortex 1, 1–47. doi: 10.1093/cercor/1.1.1
Finlay, B. L., and Darlington, R. B. (1995). Linked regularities in the development and evolution of mammalian brains. Science 268, 1578–1584. doi: 10.1126/science.7777856
Fonseca-Azevedo, K., and Herculano-Houzel, S. (2012). Metabolic constraint imposes tradeoff between body size and number of brain neurons in human evolution. Proc. Natl. Acad. Sci. U.S.A. 109, 18571–18576. doi: 10.1073/pnas.1206390109
Fox, R., Lehmkuhle, S. W., and Westendorf, D. H. (1976). Falcon visual acuity. Science 192, 263–265. doi: 10.1126/science.1257767
Frahm, H. D., Stephan, H., and Baron, G. (1984). Comparison of brain structure volumes in insectivora and primates. V. Area striata (AS). J. Hirnforsch. 25, 537–557.
Fujita, K. (1997). Perception of the Ponzo illusion by rhesus monkeys, chimpanzees, and humans: similarity and difference in the three primate species. Percept. Psychophys. 59, 284–292. doi: 10.3758/BF03211896
Fujita, K., Blough, D., and Blough, P. (1991). Pigeons see the Ponzo illusion. Learn. Behav. 19, 283–293. doi: 10.3758/BF03197888
Gardner, R. W. (1961). Cognitive controls of attention deployment as determinants of visual illusions. J. Abnorm. Soc. Psychol. 62, 120–127. doi: 10.1037/h0040838
Gottlieb, J. P., Kusunoki, M., and Goldberg, M. E. (1998). The representation of visual salience in monkey parietal cortex. Nature 391, 481–484. doi: 10.1038/35135
Gregory, R. L. (1968). Perceptual illusions and brain models. Proc. R. Soc. Lond. B Biol. Sci. 171, 279–296. doi: 10.1098/rspb.1968.0071
Haug, H. (1987). Brain sizes, surfaces, and neuronal sizes of the cortex cerebri: a stereological investigation of man and his variability and a comparison with some mammals (primates, whales, marsupials, insectivores, and one elephant). Am. J. Anat. 180, 126–142. doi: 10.1002/aja.1001800203
Healy, S. D., and Rowe, C. (2007). A critique of comparative studies of brain size. Proc. Biol. Sci. 274, 453–464. doi: 10.1098/rspb.2006.3748
Herculano-Houzel, S. (2012). Neuronal scaling rules for primate brains: the primate advantage. Prog. Brain Res. 195, 325–340. doi: 10.1016/B978-0-444-53860-4.00015-5
Herculano-Houzel, S., Watson, C., and Paxinos, G. (2013). Distribution of neurons in functional areas of the mouse cerebral cortex reveals quantitatively different cortical zones. Front. Neuroanat. 7:35. doi: 10.3389/fnana.2013.00035
Holloway, R. L., Clarke, R. J., and Tobias, P. V. (2004). Posterior lunate sulcus in Australopithecus africanus: was Dart right? C. R. Palevol 3, 287–293. doi: 10.1016/j.crpv.2003.09.030
Hubel, D. H., and Wiesel, T. N. (1968). Receptive fields and functional architecture of monkey striate cortex. J. Physiol. 195, 215–243.
Humphrey, N. (2011). Soul Dust: The Magic of Consciousness. Princeton, NJ: Princeton University Press.
Imura, T., Tomonaga, M., and Yagi, A. (2008). The effects of linear perspective on relative size discrimination in chimpanzees (Pan troglodytes) and humans (Homo sapiens). Behav. Process. 77, 306–312. doi: 10.1016/j.beproc.2007.07.006
Iwaniuk, A. N., Heesy, C. P., Hall, M. I., and Wylie, D. R. (2008). Relative Wulst volume is correlated with orbit orientation and binocular visual field in birds. J. Comp. Physiol. A Neuroethol. Sens. Neural Behav. Physiol. 194, 267–282. doi: 10.1007/s00359-007-0304-0
Jarvis, E. D., Gunturkun, O., Bruce, L., Csillag, A., Karten, H., Kuenzel, W., et al. (2005). Avian brains and a new understanding of vertebrate brain evolution. Nat. Rev. Neurosci. 6, 151–159. doi: 10.1038/nrn1606
Jerison, H. J. (1955). Brain to body ratios and the evolution of intelligence. Science 121, 447–449. doi: 10.1126/science.121.3144.447
Jerison, H. J. (1975). Fossil evidence of evolution of the human brain. Annu. Rev. Anthropol. 4, 27–58. doi: 10.1146/annurev.an.04.100175.000331
Johansen-Berg, H., Behrens, T. E., Robson, M. D., Drobnjak, I., Rushworth, M. F., Brady, J. M., et al. (2004). Changes in connectivity profiles define functionally distinct regions in human medial frontal cortex. Proc. Natl. Acad. Sci. U.S.A. 101, 13335–13340. doi: 10.1073/pnas.0403743101
Kaas, J. H. (1989). Why does the brain have so many visual areas? J. Cogn. Neurosci. 1, 121–135. doi: 10.1162/jocn.1989.1.2.121
Kaas, J. H. (2000). Why is brain size so important: design problems and solutions as neocortex gets bigger or smaller. Brain Mind 1, 7–23. doi: 10.1023/A:1010028405318
Kaas, J. H., Gharbawie, O. A., and Stepniewska, I. (2013). Cortical networks for ethologically relevant behaviors in primates. Am. J. Primatol. 75, 407–414. doi: 10.1002/ajp.22065
Kanai, R., and Rees, G. (2011). The structural basis of inter-individual differences in human behaviour and cognition. Nat. Rev. Neurosci. 12, 231–242. doi: 10.1038/nrn3000
Karbowski, J. (2007). Global and regional brain metabolic scaling and its functional consequences. BMC Biol. 5:18. doi: 10.1186/1741-7007-5-18
Kiltie, R. A. (2000). Scaling of visual acuity with body size in mammals and birds. Funct. Ecol. 14, 226–234. doi: 10.1046/j.1365-2435.2000.00404.x
Kirk, E., and Kay, R. (2004). “The evolution of high visual acuity in the Anthropoidea,” in Anthropoid Origins: New Visions, eds C. Ross and R. Kay (New York, NY: Kluwer Academic/Plenum Publishers), 539–602. doi: 10.1007/978-1-4419-8873-7_20
Krubitzer, L. A., and Seelke, A. M. (2012). Cortical evolution in mammals: the bane and beauty of phenotypic variability. Proc. Natl. Acad. Sci. U.S.A. 109(Suppl. 1), 10647–10654. doi: 10.1073/pnas.1201891109
Kubo, D., Kono, R. T., and Kaifu, Y. (2013). Brain size of Homo floresiensis and its evolutionary implications. Proc. Biol. Sci. 280:20130338. doi: 10.1098/rspb.2013.0338
Lewis, G. J., Kanai, R., Bates, T. C., and Rees, G. (2012). Moral values are associated with individual differences in regional brain volume. J. Cogn. Neurosci. 24, 1657–1663. doi: 10.1162/jocn_a_00239
Lewitus, E., Hof, P. R., and Sherwood, C. C. (2012a). Phylogenetic comparison of neuron and glia densities in the primary visual cortex and hippocampus of carnivores and primates. Evolution 66, 2551–2563. doi: 10.1111/j.1558-5646.2012.01601.x
Lewitus, E., Sherwood, C. C., and Hof, P. R. (2012b). Cellular signatures in the primary visual cortex of phylogeny and placentation. Brain Struct. Funct. 217, 531–547. doi: 10.1007/s00429-011-0338-5
Lewontin, R. C. (1998). “The evolution of cognition: questions we will never answer,” in An Invitation to Cognitive Science: Methods, Models, and Conceptual Issues, eds D. Osherson, S. D. N., and S. Sternberg, (Cambridge, MA: MIT Press), 107–132.
Li, Z. (2002). A saliency map in primary visual cortex. Trends Cogn. Sci. 6, 9–16. doi: 10.1016/S1364-6613(00)01817-9
Lund, J. S., Yoshioka, T., and Levitt, J. B. (1993). Comparison of intrinsic connectivity in different areas of macaque monkey cerebral cortex. Cereb. Cortex 3, 148–162. doi: 10.1093/cercor/3.2.148
Lyon, D. C., Jain, N., and Kaas, J. H. (1998). Cortical connections of striate and extrastriate visual areas in tree shrews. J. Comp. Neurol. 401, 109–128. doi: 10.1002/(SICI)1096-9861(19981109)401:1%3C109::AID-CNE7%3E3.0.CO;2-I
MacLean, E. L., Hare, B., Nunn, C. L., Addessi, E., Amici, F., Anderson, R. C., et al. (2014). The evolution of self-control. Proc. Natl. Acad. Sci. U.S.A. 111, E2140–E2148. doi: 10.1073/pnas.1323533111
MacLean, E. L., Matthews, L. J., Hare, B. A., Nunn, C. L., Anderson, R. C., Aureli, F., et al. (2012). How does cognition evolve? Phylogenetic comparative psychology. Anim. Cogn. 15, 223–238. doi: 10.1007/s10071-011-0448-8
Manger, P. R., Spocter, M. A., and Patzke, N. (2013). The evolutions of large brain size in mammals: the ‘over-700-gram club quartet.’ Brain Behav. Evol. 82, 68–78. doi: 10.1159/000352056
McGurk, H., and MacDonald, J. (1976). Hearing lips and seeing voices. Nature 264, 746–748. doi: 10.1038/264746a0
Moore, C. M., and Egeth, H. (1997). Perception without attention: evidence of grouping under conditions of inattention. J. Exp. Psychol. Hum. Percept. Perform. 23, 339–352. doi: 10.1037/0096-1523.23.2.339
Morwood, M. J., Soejono, R. P., Roberts, R. G., Sutikna, T., Turney, C. S., Westaway, K. E., et al. (2004). Archaeology and age of a new hominin from Flores in eastern Indonesia. Nature 431, 1087–1091. doi: 10.1038/nature02956
Nakamura, N., Fujita, K., Ushitani, T., and Miyata, H. (2006). Perception of the standard and the reversed Muller-Lyer figures in pigeons (Columba livia) and humans (Homo sapiens). J. Comp. Psychol. 120, 252–261. doi: 10.1037/0735-7036.120.3.252
Nakamura, N., Watanabe, S., and Fujita, K. (2009a). Further analysis of perception of the standard Muller-Lyer figures in pigeons (Columba livia) and humans (Homo sapiens): effects of length of brackets. J. Comp. Psychol. 123, 287–294. doi: 10.1037/a0016215
Nakamura, N., Watanabe, S., and Fujita, K. (2009b). Further analysis of perception of reversed Muller-Lyer figures for pigeons (Columba livia). Percept. Mot. Skills 108, 239–250. doi: 10.2466/pms.108.1.239-250
Neves, K., Ferreira, F. M., Tovar-Moll, F., Gravett, N., Bennett, N. C., Kaswera, C., et al. (2014). Cellular scaling rules for the brain of afrotherians. Front. Neuroanat. 8:5. doi: 10.3389/fnana.2014.00005
Parron, C., Call, J., and Fagot, J. (2008). Behavioural responses to photographs by pictorially naive baboons (Papio anubis), gorillas (Gorilla gorilla) and chimpanzees (Pan troglodytes). Behav. Process. 78, 351–357. doi: 10.1016/j.beproc.2008.01.019
Parron, C., and Fagot, J. (2007). Comparison of grouping abilities in humans (Homo sapiens) and baboons (Papio papio) with the Ebbinghaus illusion. J. Comp. Psychol. 121, 405–411. doi: 10.1037/0735-7036.121.4.405
Pasqualotto, A., and Proulx, M. J. (2012). The role of visual experience for the neural basis of spatial cognition. Neurosci. Biobehav. Rev. 36, 1179–1187. doi: 10.1016/j.neubiorev.2012.01.008
Pearce, E., Stringer, C., and Dunbar, R. I. (2013). New insights into differences in brain organization between Neanderthals and anatomically modern humans. Proc. Biol. Sci. 280, 20130168. doi: 10.1098/rspb.2013.0168
Pepperberg, I. M., Vicinay, J., and Cavanagh, P. (2008). Processing of the Muller-Lyer illusion by a Grey parrot (Psittacus erithacus). Perception 37, 765–781. doi: 10.1068/p5898
Proulx, M. J. (2011). Consciousness: what, how, and why. Science 332, 1034–1035. doi: 10.1126/science.1206704
Proulx, M. J., Brown, D. J., Pasqualotto, A., and Meijer, P. (2014). Multisensory perceptual learning and sensory substitution. Neurosci. Biobehav. Rev. 41, 16–25. doi: 10.1016/j.neubiorev.2012.11.017
Proulx, M. J., and Green, M. (2011). Does apparent size capture attention in visual search? Evidence from the Muller-Lyer illusion. J. Vis. 11:21. doi: 10.1167/11.13.21
Rauschecker, J. P. (1991). Mechanisms of visual plasticity: Hebb synapses, NMDA receptors, and beyond. Physiol. Rev. 71, 587–615.
Reiner, A., Yamamoto, K., and Karten, H. J. (2005). Organization and evolution of the avian forebrain. Anat. Rec. A Discov. Mol. Cell. Evol. Biol. 287A, 1080–1102. doi: 10.1002/ar.a.20253
Ringo, J. L., Doty, R. W., Demeter, S., and Simard, P. Y. (1994). Time is of the essence: a conjecture that hemispheric specialization arises from interhemispheric conduction delay. Cereb. Cortex 4, 331–343. doi: 10.1093/cercor/4.4.331
Rockland, K. S., and Lund, J. S. (1983). Intrinsic laminar lattice connections in primate visual cortex. J. Comp. Neurol. 216, 303–318. doi: 10.1002/cne.902160307
Roth, T. C. 2nd., Brodin, A., Smulders, T. V., LaDage, L. D., and Pravosudov, V. V. (2010). Is bigger always better? A critical appraisal of the use of volumetric analysis in the study of the hippocampus. Philos. Trans. R. Soc. Lond. B Biol. Sci. 365, 915–931. doi: 10.1098/rstb.2009.0208
Schleicher, A., Amunts, K., Geyer, S., Morosan, P., and Zilles, K. (1999). Observer-independent method for microstructural parcellation of cerebral cortex: a quantitative approach to cytoarchitectonics. Neuroimage 9, 165–177. doi: 10.1006/nimg.1998.0385
Schwartz, S., Maquet, P., and Frith, C. (2002). Neural correlates of perceptual learning: a functional MRI study of visual texture discrimination. Proc. Natl. Acad. Sci. U.S.A. 99, 17137–17142. doi: 10.1073/pnas.242414599
Schwarzkopf, D. S., Song, C., and Rees, G. (2011). The surface area of human V1 predicts the subjective experience of object size. Nat. Neurosci. 14, 28–30. doi: 10.1038/nn.2706
Segall, M. H., Campbell, D. T., and Herskovits, M. J. (1963). Cultural differences in the perception of geometric illusions. Science 139, 769–771. doi: 10.1126/science.139.3556.769
Semendeferi, K., Teffer, K., Buxhoeveden, D. P., Park, M. S., Bludau, S., Amunts, K., et al. (2011). Spatial organization of neurons in the frontal pole sets humans apart from great apes. Cereb. Cortex 21, 1485–1497. doi: 10.1093/cercor/bhq191
Sherwood, C. C., and Hof, P. R. (2007). “The evolution of neuron types and cortical histology in apes and humans,” in Evolution of Nervous Systems, The Evolution of Primate Nervous Systems, Vol. 4, eds J. H. Kaas and T. M. Preuss (Oxford: Academic Press), 355–378.
Sherwood, C. C., Lee, P. W., Rivara, C. B., Holloway, R. L., Gilissen, E. P., Simmons, R. M., et al. (2003). Evolution of specialized pyramidal neurons in primate visual and motor cortex. Brain Behav. Evol. 61, 28–44. doi: 10.1159/000068879
Sherwood, C. C., Raghanti, M. A., Stimpson, C. D., Bonar, C. J., de Sousa, A. A., Preuss, T. M., et al. (2007). Scaling of inhibitory interneurons in areas V1 and V2 of anthropoid primates as revealed by calcium-binding protein immunohistochemistry. Brain Behav. Evol. 69, 176–195. doi: 10.1159/000096986
Shultz, S., and Dunbar, R. I. M. (2010). Species differences in executive function correlate with hippocampus volume and neocortex ratio across nonhuman primates. J. Comp. Psychol. 124, 252–260. doi: 10.1037/a0018894
Sperandio, I., Chouinard, P. A., and Goodale, M. A. (2012). Retinotopic activity in V1 reflects the perceived and not the retinal size of an afterimage. Nat. Neurosci. 15, 540–542. doi: 10.1038/nn.3069
Stephan, H., and Andy, O. J. (1969). Quantitative comparative neuroanatomy of primates—an attempt at a phylogenetic interpretation. Ann. N.Y. Acad. Sci. 167, 370. doi: 10.1111/j.1749-6632.1969.tb20457.x
Stephan, H., Baron, G., and Frahm, H. D. (1988). “Comparative size of brains and brain components,” in Neurosciences, eds H. D. Stelis and J. Erwin (New York, NY: Liss), 1–38.
Stephan, H., Frahm, H., and Baron, G. (1981). New and revised data on volumes of brain structures in insectivores and primates. Folia Primatol. (Basel) 35, 1–29. doi: 10.1159/000155963
Stephan, H., Frahm, H. D., and Baron, G. (1984). Comparison of brain structure volumes in insectivora and primates. IV. Non-cortical visual structures. J. Hirnforsch. 25, 385–403.
Stevens, C. F. (2001). An evolutionary scaling law for the primate visual system and its basis in cortical function. Nature 411, 193–195. doi: 10.1038/35075572
Suganuma, E., Pessoa, V. F., Monge-Fuentes, V., Castro, B. M., and Tavares, M. C. (2007). Perception of the Muller-Lyer illusion in capuchin monkeys (Cebus apella). Behav. Brain Res. 182, 67–72. doi: 10.1016/j.bbr.2007.05.014
Teffer, K., Buxhoeveden, D. P., Stimpson, C. D., Fobbs, A. J., Schapiro, S. J., Baze, W. B., et al. (2013). Developmental changes in the spatial organization of neurons in the neocortex of humans and common chimpanzees. J. Comp. Neurol. 521, 4249–4259. doi: 10.1002/cne.23412
Tomasello, M., and Call, J. (2011). Methodological challenges in the study of primate cognition. Science 334, 1227–1228. doi: 10.1126/science.1213443
Tower, D. B. (1954). Structural and functional organization of mammalian cerebral cortex; the correlation of neurone density with brain size; cortical neurone density in the fin whale (Balaenoptera physalus L.) with a note on the cortical neurone density in the Indian elephant. J. Comp. Neurol. 101, 19–51. doi: 10.1002/cne.901010103
Tudusciuc, O., and Nieder, A. (2010). Comparison of length judgments and the Muller-Lyer illusion in monkeys and humans. Exp. Brain Res. 207, 221–231. doi: 10.1007/s00221-010-2452-7
Tyler, C. J., Dunlop, S. A., Lund, R. D., Harman, A. M., Dann, J. F., Beazley, L. D., et al. (1998). Anatomical comparison of the macaque and marsupial visual cortex: common features that may reflect retention of essential cortical elements. J. Comp. Neurol. 400, 449–468. doi: 10.1002/(SICI)1096-9861(19981102)400:4%3C449::AID-CNE2%3E3.0.CO;2-A
Wong, P., Peebles, J. K., Asplund, C. L., Collins, C. E., Herculano-Houzel, S., and Kaas, J. H. (2013). Faster scaling of auditory neurons in cortical areas relative to subcortical structures in primate brains. Brain Behav. Evol. 81, 209–218. doi: 10.1159/000350709
Keywords: cognitive evolution, brain evolution, primates, illusions, histology, brain volume, visual cortex
Citation: de Sousa AA and Proulx MJ (2014) What can volumes reveal about human brain evolution? A framework for bridging behavioral, histometric, and volumetric perspectives. Front. Neuroanat. 8:51. doi: 10.3389/fnana.2014.00051
Received: 28 December 2013; Accepted: 03 June 2014;
Published online: 25 June 2014.
Edited by:
Chet C. Sherwood, George Washington University, USAReviewed by:
Mary Ann Raghanti, Kent State University, USAMuhammad A. Spocter, Des Moines University, USA
Copyright © 2014 de Sousa and Proulx. This is an open-access article distributed under the terms of the Creative Commons Attribution License (CC BY). The use, distribution or reproduction in other forums is permitted, provided the original author(s) or licensor are credited and that the original publication in this journal is cited, in accordance with accepted academic practice. No use, distribution or reproduction is permitted which does not comply with these terms.
*Correspondence: Alexandra A. de Sousa and Michael J. Proulx, Department of Psychology, University of Bath, 2 South, Bath BA2 7AY, UK e-mail: alexandraallisonsousa@gmail.com; m.j.proulx@bath.ac.uk