Correlating technical replicates #18
Comments
|
What is the range? I would go pretty high with the cut-off. Your replicates should be right on top of each other. Maybe have @laurahspencer run the same script and figure out what her range of R2 values are? Off the cuff, I would say cut-off should be at least 0.85. |
|
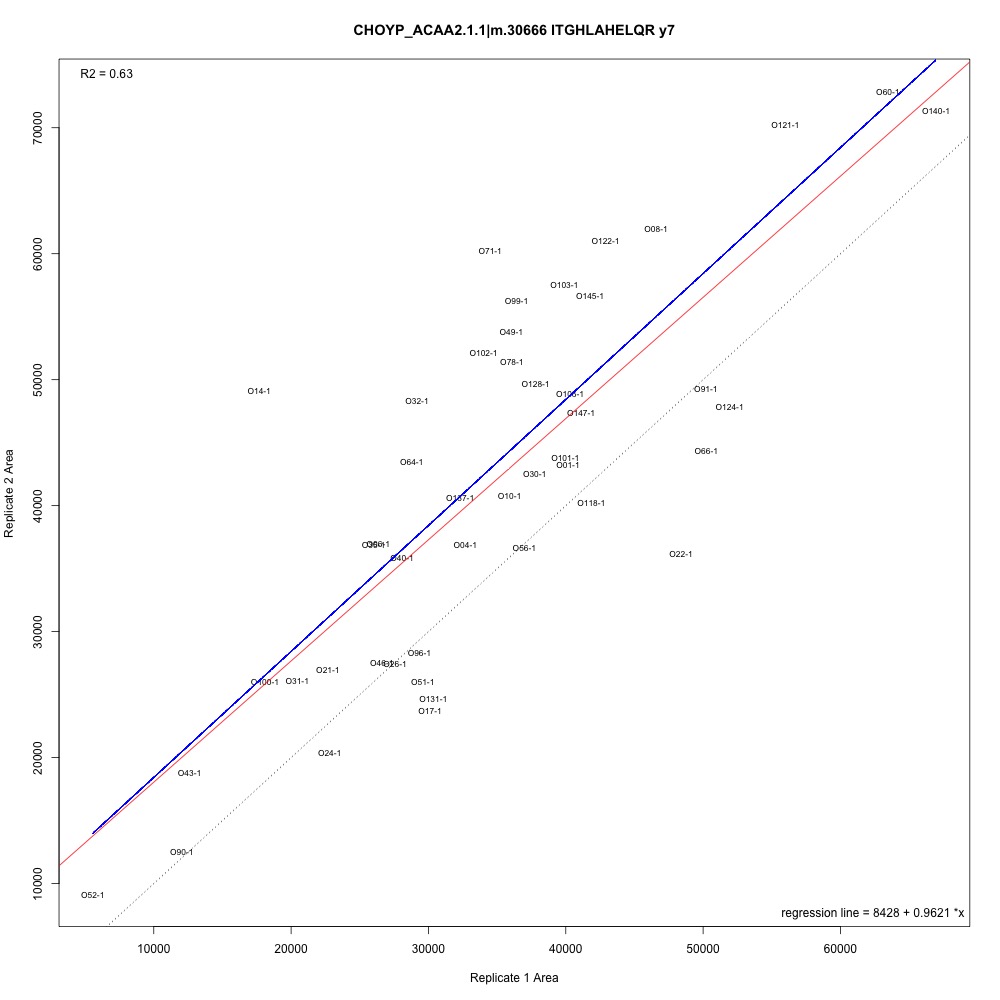
The range is .2 to .9 (there are examples of each in my notebook), with the majority being above 0.6. |
|
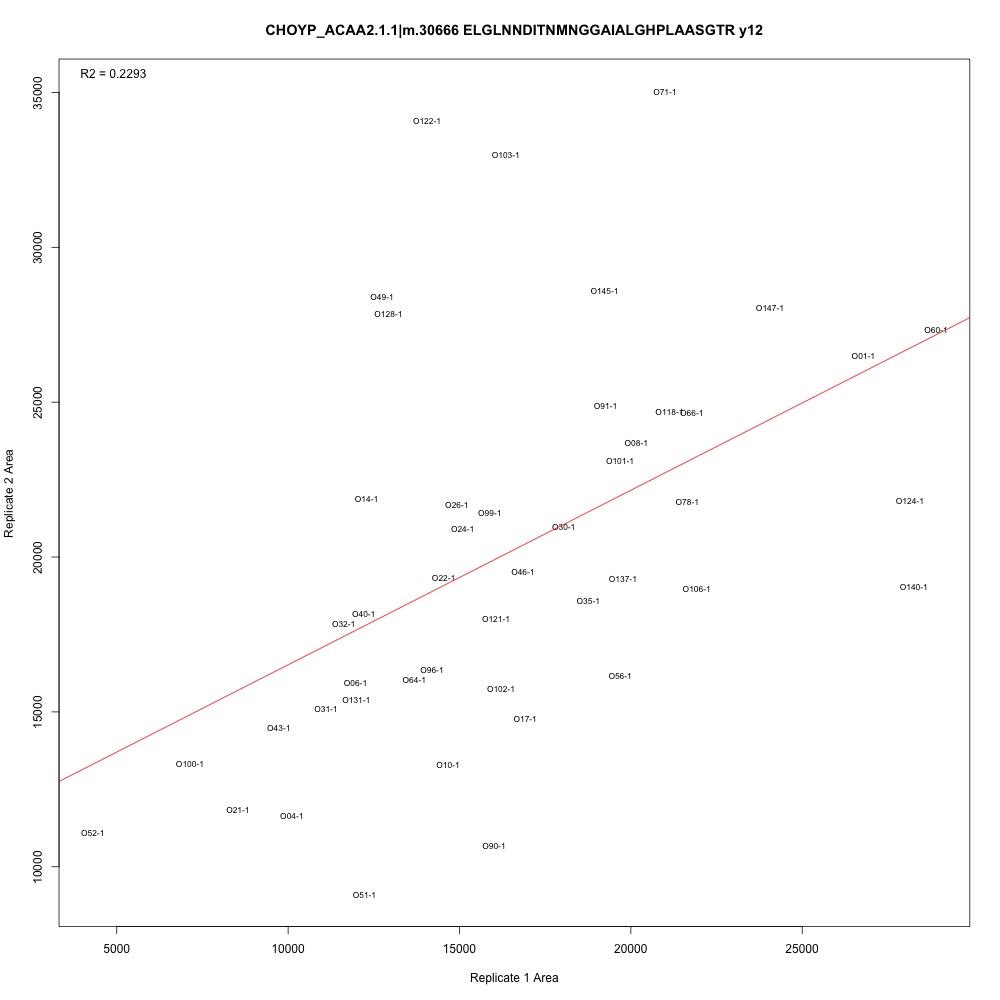
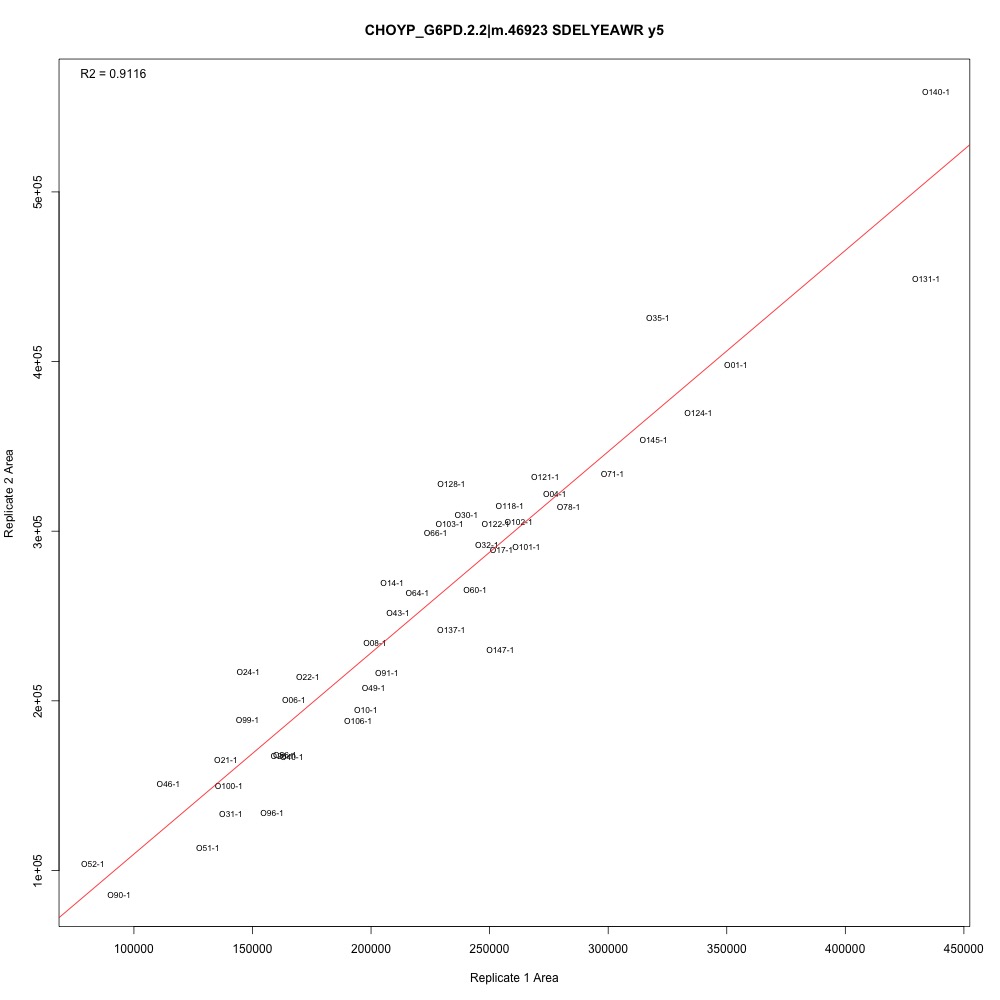
Some examples for context. Peak area from the first batch of technical replicates on the x-axis, peak area from the second batch of technical replicates on the y-axis. Points are labelled with the oyster sample ID.
|
|
To me it should be some defined range around a line that is has slope of 1. |
|
I did a quick work-up using Yaamini's script. Summary data for R^2:
NOTE: This wasn't using the full data set. I have 17 samples with 3 reps, and 3 samples with 4 reps; only the first 2 reps run are represented here, which likely skews things a bit (didn't want to dig too deep into modifying the code). |
|
Lets discuss in class
…On Wed, Oct 11, 2017 at 9:03 PM Yaamini Venkataraman < ***@***.***> wrote:
Maybe I can start with a 0.65 R-squared cutoff. If that doesn't improve
anything, work up to a 0.85 cutoff?
@sr320 <https://github.com/sr320> can you elaborate on your suggestion?
From what I understand, I would plot x = y line in addition to a linear
regression, and then consolidate the two somehow?
—
You are receiving this because you were mentioned.
Reply to this email directly, view it on GitHub
<#18 (comment)>,
or mute the thread
<https://github.com/notifications/unsubscribe-auth/AEPHt2qWGyLfhZMOFYkI-InQ8CH_UE2tks5srY93gaJpZM4P13Q->
.
|
|
I think the 0.6 cut-off sounds safe. But, of course, @sr320 makes the final call. This is pretty informative for me. I've never done this before. |
|
@emmats Here's my plan:
AT THE SAME TIME...
Thoughts? |
|
I think that sounds good. I don't think you need to normalize by TICs. If your TICs vary widely between technical replicates, then you have other problems. |
|
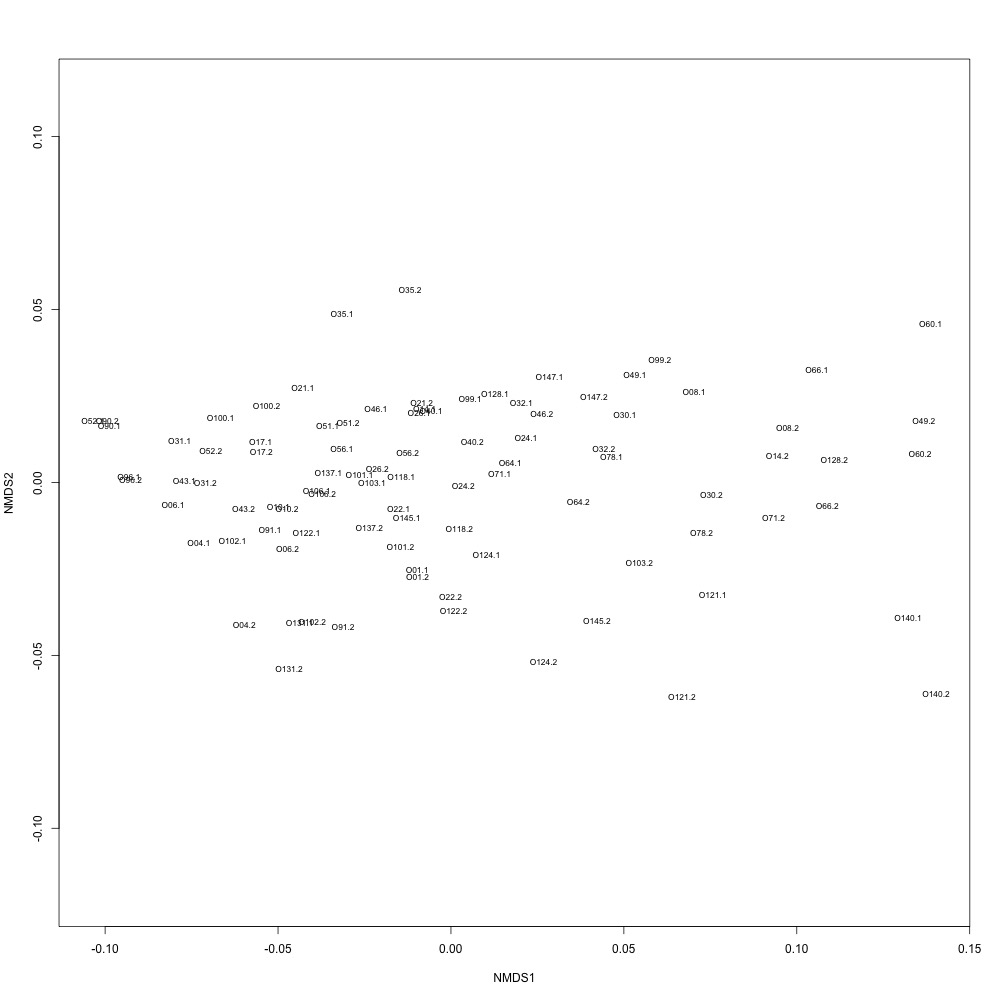
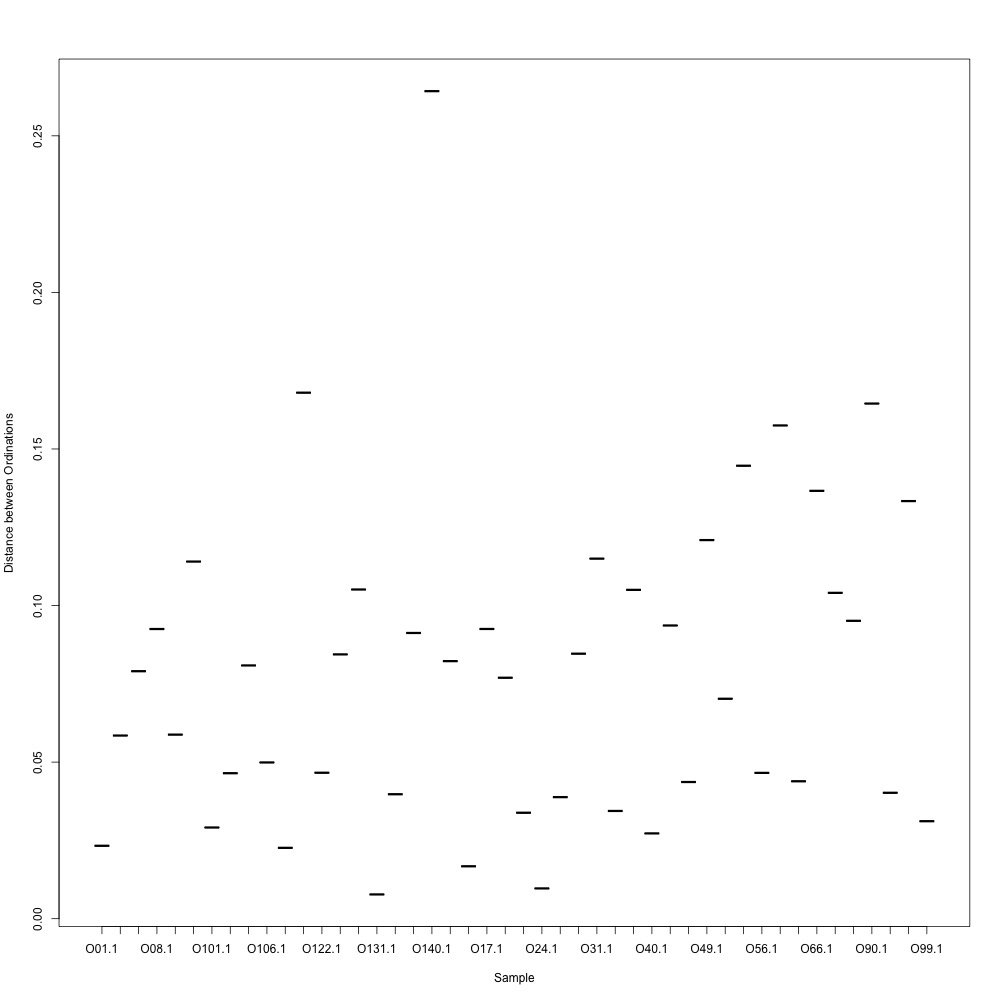
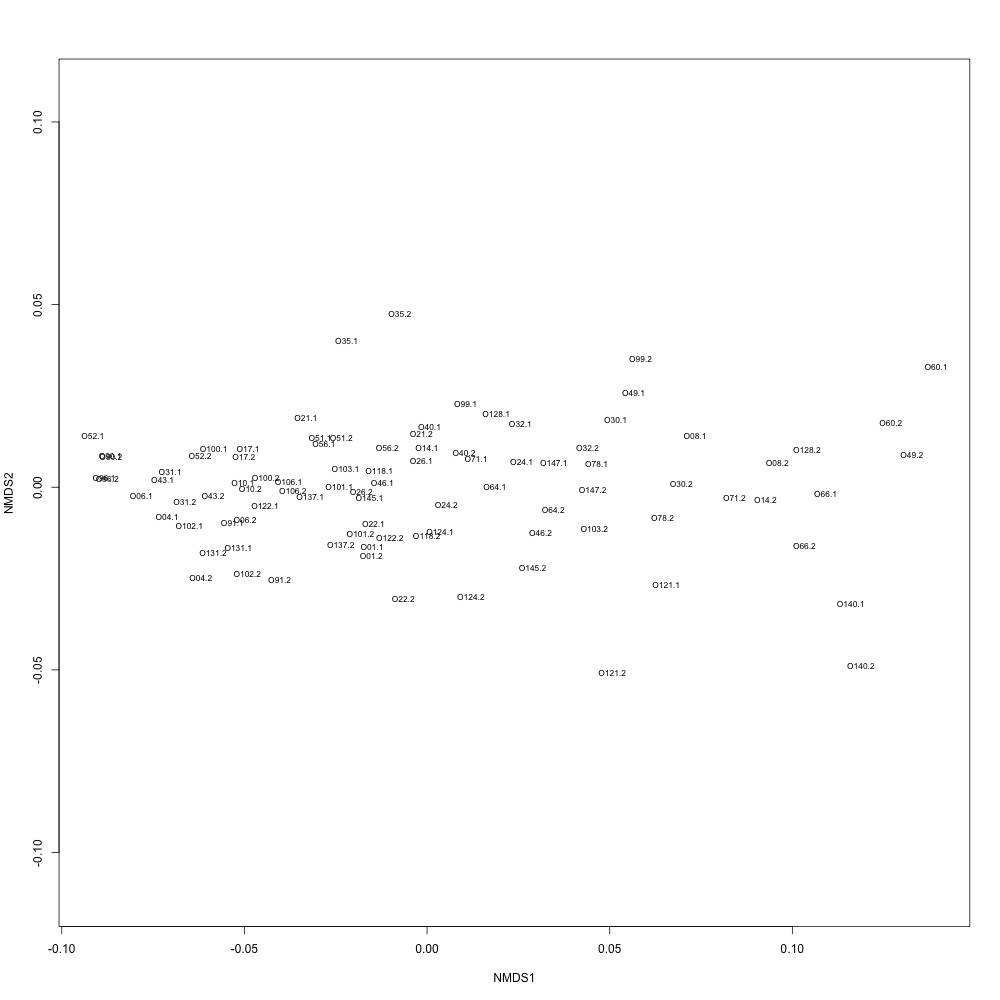
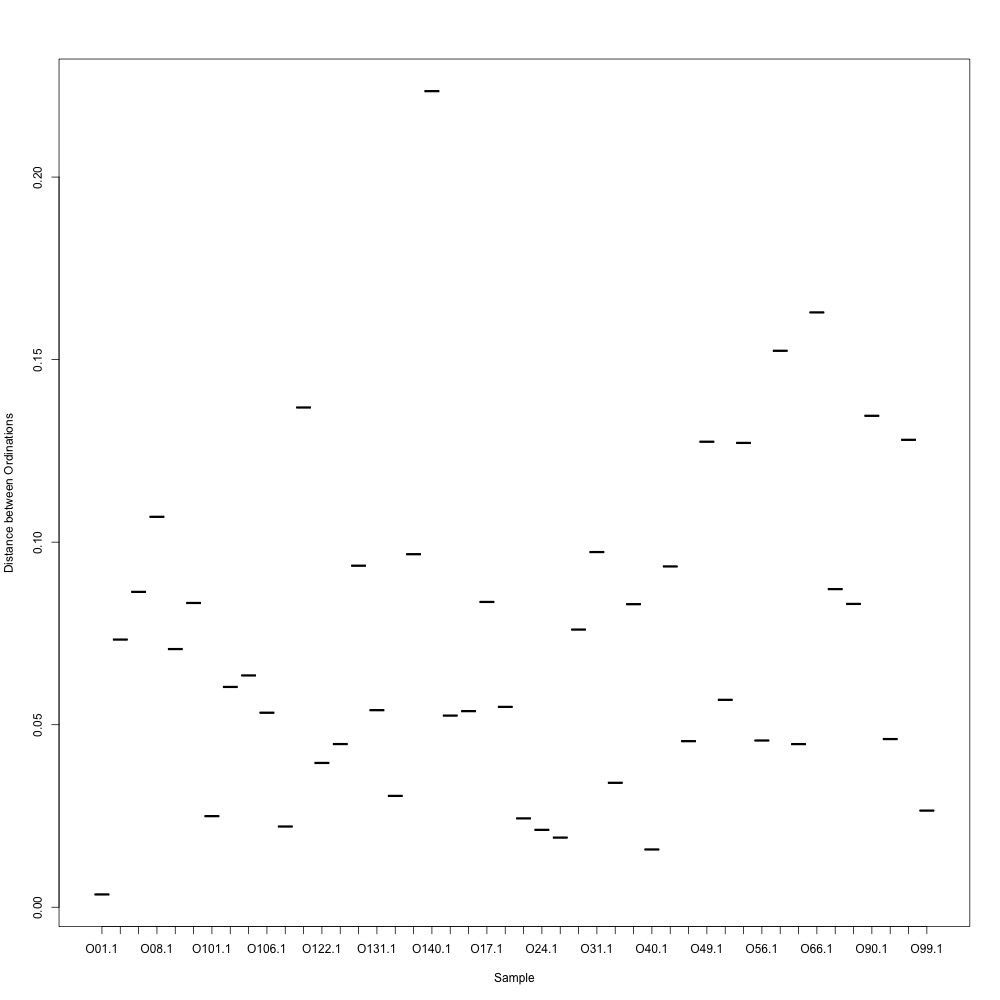
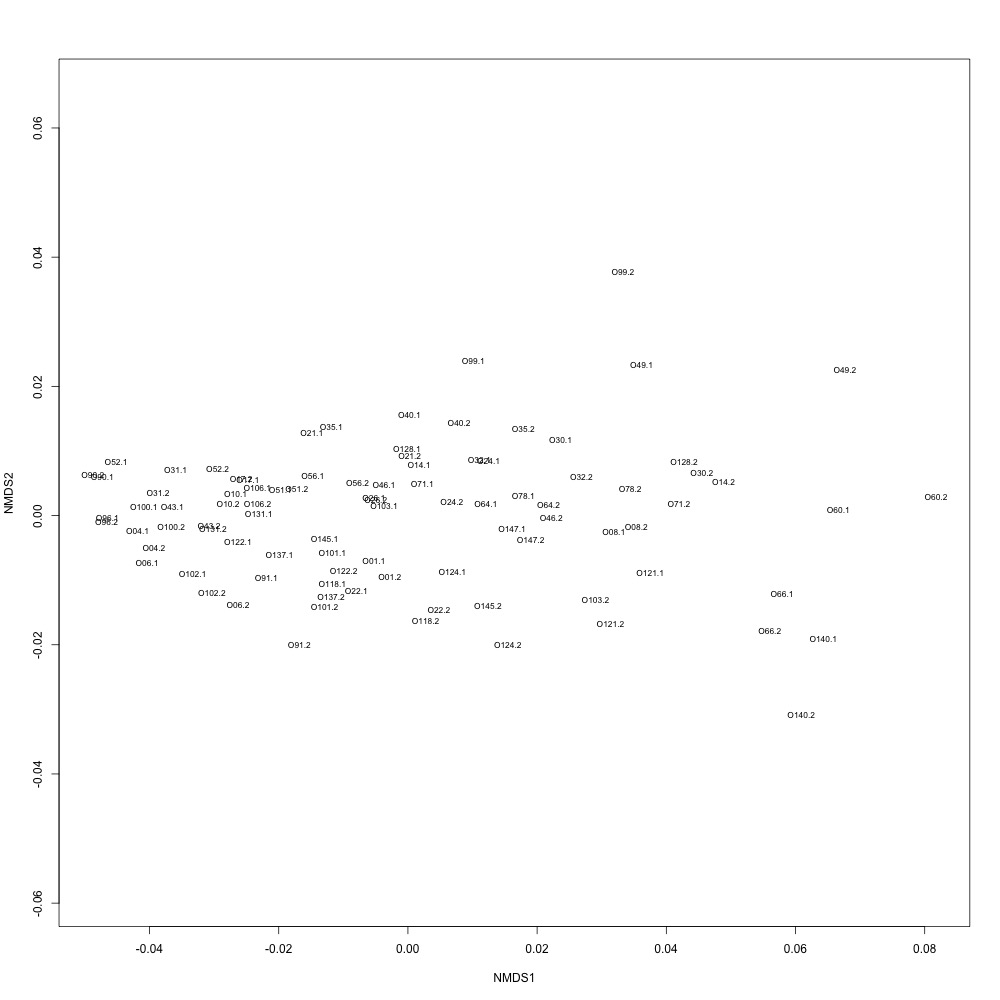
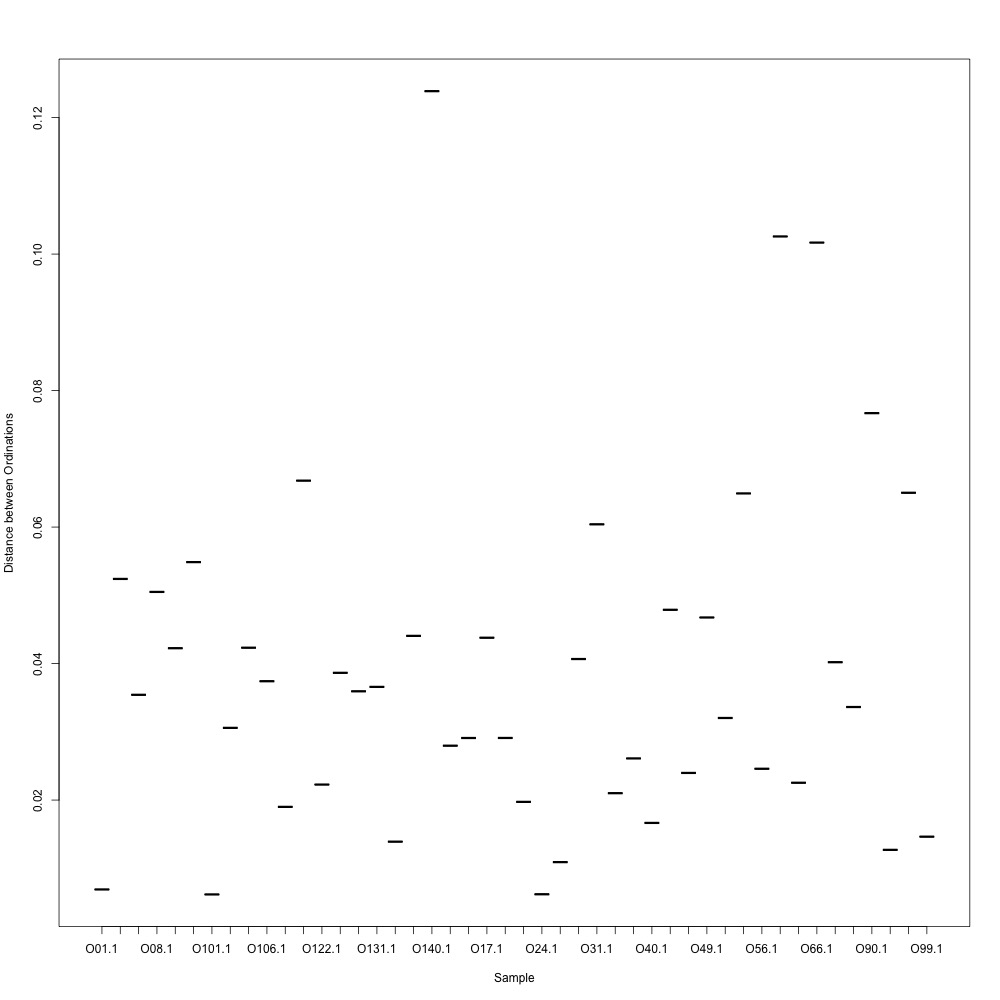
I went through the first part of my plan and used R-squared cutoffs to eliminate transitions and remake NMDS plots. I used a combination of three cutoffs (0.6, 0.7 and 0.8) and normalized/nonnormalized data. I found normalizing made my plots look a little better. Overall this helped a bit, but the technical replication still doesn't look fantastic. 0.6, normalized:
0.7, normalized:
0.8, normalized:
I'll try the second part soon, but it may take me a bit longer since making a confidence interval around a line in a for loop is a bit more tedious. Any thoughts about these results? |
|
I'm still pretty suspicious of these data. It just doesn't make sense that the technical replicates don't look the same. |
|
@yaaminiv can you please provide a csv with respective technical in adjacent columns? |
|
I was following @sr320 suggestion to look at slopes and plot a 95% confidence interval around an x = y line. Ran into some issues doing that (more details in my nb), so I can only really plot an x = y line and a prediction line (same intercept as regression, but a slope of 1) along with my data.
Any suggestions for how to move forward? A few of my issues are that there are large intercepts for the regression, so an x = y line is far removed and creating a confidence interval around an x = y line/prediction line is essentially impossible with my skill set because neither or those have any error (so plotting a CI would just lead to an upper and lower bound falling directly on top of the original line). I could look at the slope of the original regression and if it falls within some cutoff (1 ± some undetermined error value), I remove the transition and remake an NMDS? Thoughts? (esp from @emmats since you think this data is suspicious?) I'm stumped, and the only thing I think may work now might be rerunning samples (but I don't know how possible that is)... |
|
There are also transitions that have poor R squared values but slopes close to 1. What should I do about those?
|

|
Provide the new data sheet I mentioned above and I can provide feedback
…On Tue, Oct 24, 2017 at 11:34 AM Yaamini Venkataraman < ***@***.***> wrote:
There are also transitions that have poor R squared values but slopes
close to 1. What should I do about those?
[image: choyp_psa 1 1 m 27259 yfqiayplpk y4 confint]
<https://user-images.githubusercontent.com/22335838/31961321-3d222c32-b8af-11e7-9735-19268b06278b.jpeg>
—
You are receiving this because you were mentioned.
Reply to this email directly, view it on GitHub
<#18 (comment)>,
or mute the thread
<https://github.com/notifications/unsubscribe-auth/AEPHt0JfoI5q6ARUS_PR984X8O63jlfKks5svi2zgaJpZM4P13Q->
.
|
|
@sr320 The one with tech reps in adjacent columns? I linked you to that! |
|
Sorry - I need it in just two columns with the sample IDs in a column... |
|
@sr320 I think I'm confused...so sample IDs in one column, transitions in another column? |
|
Col1-transition | Col2-sampleID | Col3-rep1 | Col4-rep2 |
|
Column1 and Column2 could be switched.... |
|
normalized or not normalized? |
|
How about both... |
|
Use this data to start making graphs - simply average reps. This is just the normalized data with coefficient of variance less than 20. |
|
Used CV filtering to redo NMDS/ANOSIM analyses. Slight improvement in technical replication, ANOSIM/NMDS indicates no significant clustering pattern. Going to filter data with CV ≤ 10 and repeat. Will also look at expression of individual proteins making boxplots, etc. Interested in your thoughts @emmats. |
|
Seeing how we've answered my original question, I'm going to continue the current conversation in #35. |
As @emmats suggested, I regressed my technical replicates against each other for each transition to see if some transitions were messier than others. You can see my work in my lab notebook entry.
There are definitely some transitions with lower adjusted R squared values than others. My first instinct is to establish some sort of R-squared cutoff, remove transitions lower than this cutoff, and then remake my NMDS plot. While I'm going through each transition, I can also see if there are certain outliers or leverage points that could be influencing the R-squared values (for those close to the cutoff).
Any suggestions for what that cutoff should be?
The text was updated successfully, but these errors were encountered: