


- A look at the weekly technicals on GBPUSD, AUDUSD & USDCAD
- Review the Foundations of Technical Analysis mini-series
- Join Michael for Live Weekly Strategy Webinars on Mondays at 12:30GMT
In this series we scale-back and take a look at the broader technical picture to gain a bit more perspective on where we are in trend. Here are the key levels that matter on the USD Majors heading into the yearly close. Review this week’s Strategy Webinar for an in-depth breakdown of these setups and more.
GBP/USD Weekly Chart

Notes: Sterling has continued to trade within the confines of a well-defined pitchfork formation dating back to 2016. Price rebounded off the lower parallel last month before testing the yearly high-week reversal close at 1.3494. Heading into the start of 2018 the focus remains weighted to the topside while within this formation with a breach higher targeting the 2016 high-week reversal close at 1.3675 and the median-line / 38.2% retracement at 1.3952.
Bottom line: Cable remains constructive heading into the yearly close. A break below the November high-day close at 1.3036 (bullish invalidation) would be needed to shift the broader focus lower with such scenario targeting the 52-week moving average at ~1.2870s backed by former slope resistance at ~1.2680s.
New to Forex? Get started with this Free Beginners Guide
AUD/USD Weekly Chart
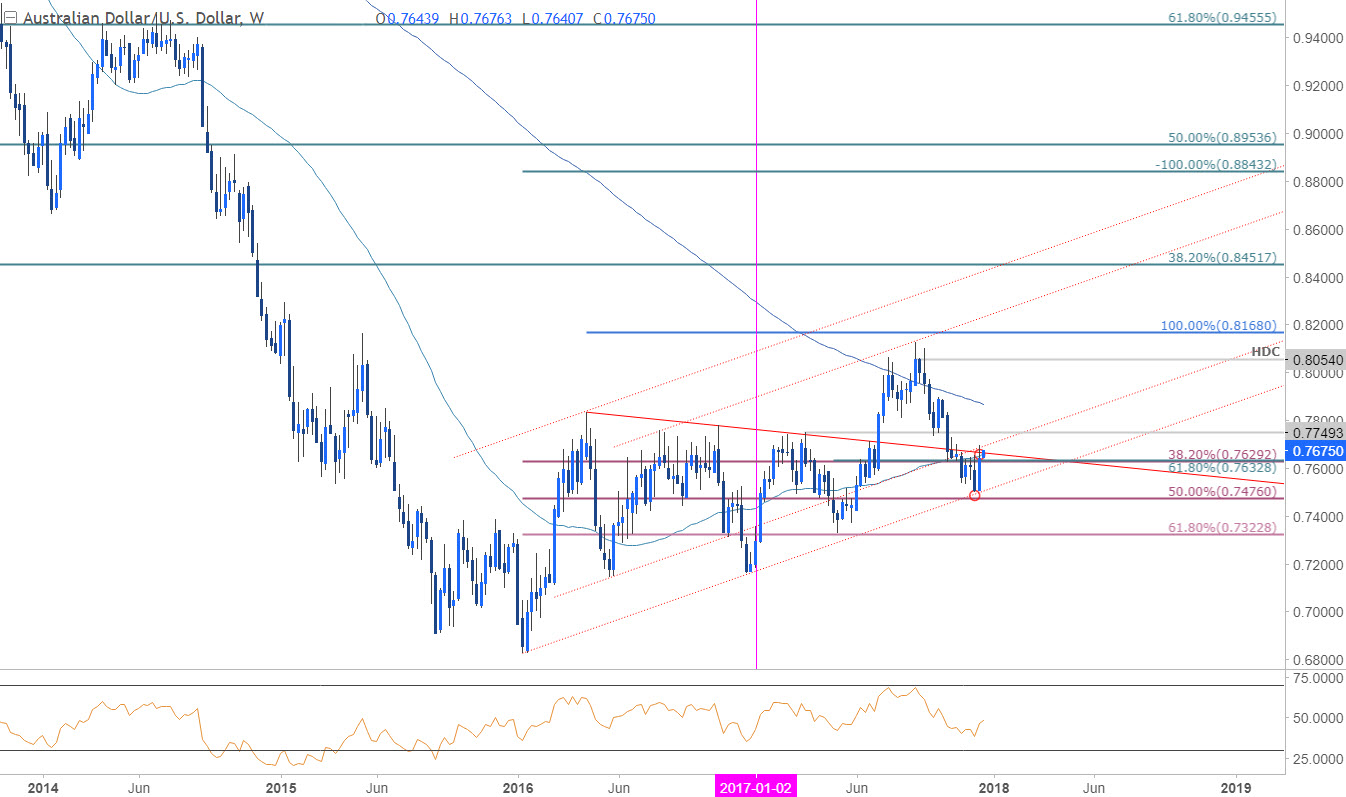
Notes: We’ve been tracking the Aussie decline off the yearly highs for months now with price rebounding off critical confluence support at 7476-7500. Last week’s reversal keeps the focus weighted to the topside while above this key threshold. A breach above the March spike high at 7749 would be needed to confirm that a more significant low is in place.
Bottom line: Looking to fade weakness while above 7476 with a breach higher targeting the 200-week moving average at ~7860s and the 2017 high-week close at 8054. A break lower from here would risk considerable technical damage for Aussie with such a scenario targeting 7322 backed by 7160.
See how shifts in AUD/USD retail positioning are impacting trend- Click here to learn more about sentiment!
USD/CAD Weekly Chart

Notes: Loonie has continued to hold below the 50% retracement of the 2017 range- note that this level converges on the downslope resistance and has continued to govern the highs since late-October. Heading into the close of the year the focus is on a break of the 1.2575-1.2927 range to offer guidance (downside break favored).
Bottom line: We’ll maintain a neutral stance here for now, but the broader outlook remains weighted to the downside while within this descending pattern- Its either a breach higher and a run into the upper parallel (near 1.3330s), OR a break lower to tempt shorts here. Ultimately a downside break would have me targeting the median-line at ~1.2320s and the key Fibonacci zone between 1.1425-1.1564.
Check out our USD/CAD projections on the in our Free DailyFX Trading Forecasts
Previous Weekly Technical Perspectives
- A Weekly Technical Perspective on DXY, AUD/USD, USD/CAD & Crude
- A Weekly Technical Perspective on DXY, GBP/USD & Crude
- Written by Michael Boutros, Currency Strategist with DailyFX
Follow Michaelon Twitter @MBForex contact him at mboutros@dailyfx.com or Click Here to be added to his email distribution list.


