Guest essay by Dr. Indur M. Goklany
Periodically we are flooded with reports of air pollution episodes in various developing countries, and claims of their staggering death toll, and consequent reductions in life spans. The Economic Times (India), for example, recently claimed:
If you are in NCR [National Capital Region, i.e. Delhi] right now, you may have a shorter lifespan
Nov 09, 2017, 05.11 PM IST
Can’t breathe
With pollution levels in NCR 40 times the World Health Organization’s safe limit, your life expectancy could be cut short…
Killing you softly
The US embassy website said levels of the fine pollutants known as PM2.5 that are most harmful to health reached 703 — well over double the threshold of 300 that authorities class as hazardous. PM2.5 are particles with a diameter of 2.5 micrometers or less and a study recently found that a 10 µg/m3 (per cubic meter of air) increase leads to a 1.03 year reduction in life expectancy…
What happens if something is done about it
In Delhi, people could live as much as nine years longer if India met WHO standards, and six years longer if it met its own standards. Similarly, people in other metros like Kolkata and Mumbai could live for around 3.5 years longer if India complied with WHO standards.
Not to be outdone, the BBC has a video online, Bosnia’s silent killer — air pollution:

How credible are these reports? Are aggregate data on life expectancy consistent with such claims? Here I will focus on air pollution from PM2.5, which are generally regarded to be the deadliest form of air pollution (and the subject of the above reports).
Consider that Delhi might have the worst respirable suspended particulate matter (RSPM) air quality among India’s major cities (Figure 1). But — surprise — it also has the second highest life expectancy among India’s states (73.2 years for 2010-2014)! [1] By contrast, average life expectancy for India is 67.9 years.

Figure 1: Concentration of respirable suspended particulate matter (RSPM) in residential and industrial areas in major Indian cities. Source: Hosamane SN, Desai GP. 2013. Urban air pollution trend in India-present scenario. International Journal of Innovative Research in Science, Engineering and Technology 2: 3738-47.
Similarly, Beijing, hardly the cleanest place in China, has its 2nd highest life expectancy, 82.0 yrs, behind Shanghai (83.2 yrs in 2016). The national average was 76.3 yrs in 2015.[2] By contrast, Hawaii, the state with the highest life expectancy in the U.S., had a life expectancy of 81.2 yrs in 2014,[3] while the U.S. average was 78.8 yrs in 2015!
[But can Chinese data be trusted? Yes (at least in Beijing), according to a report in the New York Times[4] … but can the NYT be trusted? ].
Trends in Population Exposure to PM2.5 and Life Expectancy
CHINA & INDIA
Figures 2 and 3 show trends in estimates of mean population exposure to ambient PM2.5, life expectancy, CO2 emissions (a surrogate for industrial activity and fossil fuel use), and GDP per capita (a surrogate for both income and economic well-being) for China and India, respectively. [Although I would not rely on these PM2.5 exposure estimates for any quantitative purposes, I will assume that they are good enough to identify broad qualitative trends.]

Figure 2: China — Trends in (1) GDP per capita (in constant PPP adjusted 2011 international dollars); (2) CO2 emissions (in million metric tons of carbon), (3) population weighted annual ambient exposure to PM2.5 based on Brauer, M. et al. 2016, for the Global Burden of Disease Study 2015; (4) life expectancy (in years). Sources: CO2 data from CDIAC; all other data from the World Bank’s World Development Indicators.

Figure 3: India — Trends in (1) GDP per capita (in constant PPP adjusted 2011 international dollars); (2) CO2 emissions (in million metric tons of carbon), (3) population weighted annual ambient exposure to PM2.5 based on Brauer, M. et al. 2016, for the Global Burden of Disease Study 2015; (4) life expectancy (in years). Sources: CO2 data from CDIAC; all other data from the World Bank’s World Development Indicators.
These figures show:
· Life expectancies increase even as both GDP per capita and CO2 emissions increase. [Note that China’s life expectancy declined toward the beginning and end of the 1960s. This was probably because China still had not conquered hunger and food supplies per capita were consequently low.]
- Life expectancies have gone up despite increases in ambient PM2.5 exposure.
- GDP per capita tracks fairly well with CO2 emissions.
BOSNIA-HERCEGOVINA (BOSNIA for short)
Bosnia-Hercegovina is an interesting case, as can be seen by Figure 4. To put this figure in context, consider that Bosnia underwent drastic social, political and economic turmoil during the 1980s and through the early 1990s. Following Tito’s death in 1980, Yugoslavia disintegrated into its constituent pieces, and Bosnia-Hercegovina emerged as an independent state in 1992. Shortly thereafter, the Bosnian War got underway. It ended formally in 1995.
During this period of upheaval, GDP per capita and fuel use declined temporarily, as did CO2 emissions and mean population exposure to PM2.5. Not surprisingly, because of war casualties and, possibly, declines in GDP per capita and fossil fuel use, life expectancy declined somewhat. By 1994, GDP per capita had started to climb again, and so did fossil fuel use and life expectancy. However, PM2.5 exposure stayed more or less constant through the early 2000s, after which it increased (i.e., deteriorated), yet life expectancy has continued to increase.

Figure 4: Bosnia — Trends in (1) GDP per capita (in constant PPP adjusted 2011 international dollars); (2) CO2 emissions (in million metric tons of carbon), (3) population weighted annual ambient exposure to PM2.5 based on Brauer, M. et al. (2016), for the Global Burden of Disease Study 2015; (4) life expectancy (in years). Sources: CO2 data from CDIAC; all other data from the World Bank’s World Development Indicators.
The above figures (2–4) also indicate that for each of the three countries, it’s not evident that PM2.5 shortens lifespans or, if it does, its effects are more than overwhelmed by increases in life expectancy enabled directly or indirectly by economic growth (which is underpinned by fossil fuel use).
[The figures also show that CO2 emissions rose much more rapidly in each country than PM2.5 — see the following table. This suggests that each society had determined formally or informally that they would rather first obtain the benefits associated with fossil fuel use before turning their attention to reducing PM2.5 exposure or, for that matter, foregoing the benefits of fossil fuel use. This should be kept in mind when one develops estimates of the willingness to pay for co-benefits from PM2.5 reductions as part of any analysis of the costs and benefits of CO2 reductions, or in the calculations of the social cost of carbon. In other words, real world data does not support the notion that people are willing to pay for reductions in PM2.5 (or other pollutants) at the expense of foregoing fossil fuel use except in extraordinary circumstances. This notion might have been valid once upon a time for colorless and odorless gases, and had the effects of air pollution been unknown, but it can no longer be considered true today given the wide coverage of pollution matters in the local and international media and the internet, and the emphasis on renewable sources and pollution controls.]
| China | India | Bosnia & Hercegovina | |
| Increase in PM2.5 exposure from 1995 to 2014 = ΔPM2.5 | 17% | 18% | 17% |
| Increase in CO2 emissions from 1995 to 2014 = ΔCO2 | 210% | 176% | 648% |
| Ratio of growth from 1995–2014
= ΔCO2/ΔPM2.5 |
12.5 | 9.7 | 32.3 |
UNITED STATES
Let’s now look at data from the United States.

Figure 5: United States — life expectancy (yrs), GDP per capita (1990 International, PPP-adjusted $), SO2 and PM10 emissions (million short tons), PM2.5 (mean annual exposure, μg/m3). Sources: Updated from Goklany. The improving state of the world: why we’re living longer, healthier, more comfortable lives on a cleaner planet, Cato Institute (2007) using: Haines, Michael R. , “ Expectation of life at birth, by sex and race: 1850–1998 ”; Historical statistics of the United States, colonial times to 1970, US Department of Commerce, Bureau of the Census (1975); CDC (2016); CDIAC (2017); World Bank Data Bank (2017).
In addition to trends in estimates of mean exposure to ambient PM2.5, life expectancy, CO2 emissions, and GDP per capita, Figure 5 also shows trends in sulfur dioxide (SO2) and PM10. [SO2 is a proxy for sulfate aerosols, which would be a component of PM2.5 and also PM10. Note the dramatic reductions in PM2.5 since 1990.]
This figure shows that life expectancy has been increasing, with occasional setbacks, since at least 1850. These improvements got steadier after 1880, a period during which fossil fuel use began to take off, but with occasional relapses, e.g. 1916–1918 during World War I and the Spanish flu epidemic, the Depression era years, and World War II years). But since World War II, the more or less steady increase in life expectancy has been punctuated by fewer and smaller relapses.
Over the entire period, 1850–2015, air pollution levels would have first increased as society’s reliance on fossil fuels and industrialization increased. Then, one by one, the various pollutants were reduced. As noted elsewhere, the order in which these pollutants peaked seem to more or less follow the order in which society perceived (or became aware) of their negative impacts.[5]
Setting aside the steep decline in life expectancy from 1916–1918, Figure 5 reinforces the observations made from Figures 2 through 4, namely: (a) life expectancy is better correlated (and improves) with GDP per capita and CO2 emissions, than pollution levels, and (b) and it has continued to improve, notwithstanding trends in pollution from fossil fuel combustion. The information on Figure 5 is broadly consistent with data on deposition from various forms of airborne particulate pollution from the Arctic from 1788–2003, shown in Figure 6. [6] The latter probably reflects a composite of industrial and forest fire activities in both the U.S. and Canada. [Significantly, because of the steady increase in urbanization since the late 18th century, mean exposure to PM would have risen more steeply than indicated by emissions alone; this casts further doubt on the purported detrimental effect of PM on life expectancy.]

Figure 6: Air pollution deposition in the Arctic, 1788–2003. (A) Annual average concentrations of black carbon (BC) and vanillic acid (VA). VA is an indicator of boreal forest fires. The gray shaded region represents the portion of black carbon (BC) attributed to industrial emissions, not boreal forest fires. (B) Annual average concentrations of BC and non-sea-salt sulfur (nss-S). Spikes in nss-S are from explosive volcanic eruptions (e.g., Tambora, 1816; Krakatoa, 1883; and Katmai, 1912). Source: McConnell et al. (2007)
An examination of historical trends for other countries indicates that for the most part each country follows the same general script outlined above, namely, industrialization, stoked by increases in fossil fuel use, has increased GDP per capita and is associated with increases in life expectancy, regardless of whether air pollution levels went up or down. The exceptions to this pattern would be countries that have easy access to alternative energy sources, e.g., hydropower, and/or nuclear. Also, there might be discontinuities in the general increases in GDP per capita, fossil fuel use and life expectancy for some countries during periods of major economic, social and political disruptions such as the collapse and disintegration of the Soviet Union and the restructuring of its satellite states.
To recap, the death toll from air pollution caused by fossil fuel combustion — and the resulting decline in life expectancy — are, to quote Mark Twain, greatly exaggerated. In fact, for whatever reason, life expectancy increases in association with fossil fuel use.
Finally, some may argue that while PM2.5 may not reduce life expectancy, it may actually make the population sicker. But this argument fails scrutiny.
The following table compares (unadjusted) life expectancy at birth in 1950 against “health-adjusted life expectancy” (HALE) in 2000 and 2015 for the U.S., the world’s two-most populous countries — India and China, and the world. [HALE is a measure that tries to combine the quantity of life (i.e., its length) with the quality of health experienced over that lifespan. The World Health Organization defines HALE as the “average number of years that a person can expect to live in full health by taking into account years lived in less than full health due to disease and/or injury.”][7] The table shows that HALE today substantially exceeds the unadjusted life expectancy in 1950. [1950 is shortly before the China and India began to industrialize in earnest. It is also at the start of a fresh burst of industrialization in the U.S. — see Figure 5). In other words, we are not only living longer, we are staying healthier for a longer period of time.
| Life expectancy in
1950 (unadjusted) (yrs) |
Health-adjusted life expectancy in 2000
(yrs) |
Health-adjusted life expectancy in 2015
(yrs) |
|
| China | 41 | 64.6 | 68.5 |
| India | 32 | 54.2 | 59.6 |
| USA | 68 | 67.2 | 69.1 |
| World | 49 | 63.1 | |
| Atmospheric CO2 level (ppm) | 311 | 370 | 401 |
Unadjusted and health-adjusted life expectancy (HALE) for China, India, U.S., and the World. Health-adjusted life expectancy adjusts unadjusted life expectancy downward to account for the amount of time spent in an unhealthy condition and the severity of that condition. Sources: Maddisson (2001), p.30; ESRL Mauna Loa data, ftp://aftp.cmdl.noaa.gov/products/trends/CO2/CO2_annmean_mlo.txt WHO (2016), http://gamapserver.who.int/gho/interactive_charts/mbd/hale_1/atlas.html
So why the discrepancy between claims that PM2.5 (or air pollution more generally) reduces life expectancy, and the reality that life expectancy has actually increased, and continues to increase in some of the most polluted cities of the world despite increases in PM2.5?
A couple of reasons, which are not mutually exclusive, come to mind:
- The cumulative direct and indirect effects of economic development (and fossil fuel use) on life expectancy not only outweigh the effects of PM2.5, they also enable populations to reduce PM2.5, once more significant health threats are reduced.[8]
- Life expectancy is based on data on real births and real deaths, whereas the mortality effects of PM2.5 are based on “statistical” deaths or, to use a term currently in vogue, “fake” deaths.[9] As Steve Milloy is fond of asking, “Where are the bodies?”[10]
In today’s world, claims of air pollution shortening life expectancy are fake news premised on fake deaths.
[1]http://www.censusindia.gov.in/Vital_Statistics/SRS_Life_Table/2.Analysis_2010-14.pdf.
[2] https://gbtimes.com/beijings-average-life-expectancy-hits-record-high.
[3] http://www.businessinsider.com/us-states-with-the-highest-and-lowest-life-expectancy-2017-5.
[4] https://www.nytimes.com/2016/03/31/world/asia/china-air-pollution-beijing-shanghai-guangzhou.html?_r=0.
[5] Goklany IM. Have increases in population, affluence and technology worsened human and environmental well-being. The Electronic Journal of Sustainable Development. 2009;1(3):1; p. 15.
[6] McConnell JR, Edwards R, Kok GL, Flanner MG, Zender CS, Saltzman ES, Banta JR, Pasteris DR, Carter MM, Kahl JD. “20th-century industrial black carbon emissions altered arctic climate forcing,” Science. 2007 Sep 7;317(5843):1381-4.
[7] http://www.who.int/healthinfo/statistics/indhale/en/
[8] Goklany IM. Have increases in population, affluence and technology worsened human and environmental well-being. The Electronic Journal of Sustainable Development. 2009;1(3):1
[9] Estimates of deaths from air pollutants are based on epidemiological studies. However, these studies have several shortcomings. They include the fact that it is inappropriate to use outdoor monitors fixed in space to represent population exposure to PM2.5 (because most people move around, spend a substantial period of time indoors, and indoor and outdoor air quality may not always be the same for a variety of reasons). Steve Milloy has an extensive critique of a recent epidemiological air pollution study that illustrates many of these shortcomings.
[10] Milloy S. Claim: PM2.5 killed 1.22 million Chinese in 2013 — So where are the bodies?
living in pasadena in the early 70’s you could get bloody nose from breathing the sulfuric air outside.
gnomish
Having spent 19 years in a sulfuric acid plant, your comment has some merit. I can account for a stuffy nose. My bloody nose comes from three days employed at International Galvanizing, just west of Goodyear Tire and Rubber, I-10 East Beaumont. When they drop cold steel into the hot acid bath, the wind flowing through the building brought that awful mess down to the end we worked.
There was a time the stack measured 3000ppm. Today? 100
I grew up in a copper mining – and smelting – town. When we had an inversion, it was actually painful to breathe.
But that happened perhaps a half dozen times a year, at most. For compensation, we had a very vibrant economy. State of the art hospital (when air ambulances became common, the patient was sent either to Phoenix or my local hospital; if the flight times were roughly equivalent, they would send them to my local hospital as the first choice).
State of the art high school (well, in the district that the mine was located in – but even my schools had plenty of money from the taxes on miners that lived over on “my side” and the business that served them).
Now? The area is virtually a ghost town these days. No really good jobs (except for Federal ones). The hospital is mostly a long term care unit, with a tiny clinic. The high school is essentially gone – they keep trying to revive it as a trade school, but there just aren’t enough young people left to make it worthwhile.
Not all of this decline was due to the extreme expenses of installing the pollution controls – the overly greedy unions and the end of the construction boom was a good part of it – but it certainly started the death spiral.
(As my dad used to say when it got bad… “That’s the smell of money. Money in our pockets.” He wasn’t a miner, he was the local veterinarian; but everybody paid when the mines had problems.)
What was the lifespan of the caveman ?
http://jonjayray.com/gremar07_files/cavemen+died+young.gif
Average life expectancy is a curious number that I first questioned when researching family history. Back in the 17th, 18th and 19th and early 20th centuries I found that most of my forebears died in their 80s or 90s with a number reaching a few months short of 100 years.
I couldn’t square this with the accepted figures of lifespans of 45-55 years as being the average lifespan in those periods until I looked at how many children died in infancy, before the age of 1, 2 or 3.
Then it became clear to me that one of the biggest factors in Life Expectancy is infant mortality. If adults have an average lifespan of 85 years (as was roughly the case in my family) But infant mortality is around 30% to 40% then of course the Average lifeapn would fall dramtically down to figures of around 45-55 years.
I suspect that medical care hs improved in many parts of the world and that has asignificant part in increasing life expectancy.
It is the third world which is being denied reliable energy that suffers the highest levels of infant mortality and thus has the lowest life expectancy rates.
But we lived only 30 years. The paradise is death.
And those were dangerous periods of time in the US with many deaths directly attributed to accidents, diseases, murders, robbery, land disputes, …… as well as the French, English, Indian & Civil War(s).
There was a horrendous number deaths that can be attributed to the Civil War …. but only the deaths of military personnel directly resulting from Military action were kept a good accounting of.
interesting point, researchers have said it appears that humans have developed the ability to breathe smoke in far higher levels than any other creature on this earth is able or willing to, due to the thousands of years our ancestors have spent huddled around open hearth fires in small spaces.
It would explain the strange enjoyment many people get from breathing in the smoke that comes from burning certain kinds of dried leaves. Impossible to think of any other animal on earth that would willingly do that.
Their air was not clean, they were heavily exposed to indoor air pollution from open fires for cooking and heating. This form of pollution is considered the most unhealthy pollution today, shortening the life of the poorest people.
Furthermore their water was not pure at all. It is difficult to avoid polluting the water sources by leakage from the tribemembers pollutants.
In addition their food was rotten much of the time because of lack of appropiate conservation methods.
Old England
You are right of course regarding child deaths bringing down the average age not to forget the young mothers that often died giving birth in the first place.
To this must be added, periodically, the numerous wars which would affect mostly young men.
If you survived those specific circumstances many people lived to a ripe old age as the headstones in the old cemeteries will testify
Tonyb
Don’t forget about infections. A relatively minor injury could be a death sentence to any healthy person in the age before penicillin.
wws
November 29, 2017 at 7:04 am
WWS, it doesn’t require a Degree holding researcher with ten-of-thousands-of-DOLLAR$ in Grant monies to have figured that out.
Anyone that possesses the abilities of common sense thinking, logical reasoning and intelligent deduction …. could, should and/or did …… arrive at the same conclusion like “jiffy quick”.
Homo sapiens and/or their ancestral hominoids have been inhaling “tons” of smoke from burning “biomass” ever since they per se “invented” the use of fire for cooking and keeping warm by.
And keep in mind, it has only been during the past 80 to 100 years that a majority of the US population has been living in a “cooking/heating” smoke-free interior atmosphere. Central heating did not become the “norm” until post-1950, And the in-home living conditions for the rest of the worlds populations are not up-to-par to Americans.
Iffen burning biomass “smoke” causes death of the inhaler, ….. then General Custer would never have had to fight his last battle at the LBH.
I lived 3 miles from the foundry at ford motors. We had to buy an acid every year to clean the dust out of the cars paint. That was 55years ago.
Stephen and others,
I was born in rural Ireland over 75 years ago, the youngest of eight. In winter we huddled around an efficient turf (peat) open fire with several layers of clothing to try and keep warm. We needed to keep a window open to encourage the smoke to go up the open chimney when the atmospheric pressure was low.
All my life I have enjoyed the evils of tobacco and the grape. At present my waist measures 34 inches and I weigh 11 stone (154 pounds for Americans). This is 8 pounds more than when I married my beautiful ex fiance nearly 50 years ago. For several years I have practiced a low carb high protein diet.
I carry my clubs around a renound golf course 3 or 4 times a week.
At a recent medical my doctor asked how am I so healthy with my decrepit lifestyle.
I told her it was entirely due to choosing my parents very carefully – they both lived into their eighties
Beautifully stated, ….. waterside4, …… reminds me of my own “bio”.
I am #10 of 11 children born to my parents and I am now “three months” into my 78th trip around the Sun. My early home life included wood and/or coal burning cook stoves, heating stoves and open fireplaces.
Both of my parents and both sets of grandparents lived past their 86/90th birthdays …… and all of my siblings except 4 are still alive. One death due to old age, the other 3 due to accidents.
So it appears that I too … chose my parents very carefully.
“Show me the bodies” is exactly on point. Epidemiological mortality models seem to have the same sort of reality as climate models.
I just used that point on a thread with Mark Lynas over glycophosphate use. Epidemiology is a statistical pseudo science at low levels of significnace it si not evidence for anything, at higher levels correlation is not causation, not deterministc science, Feynman’s pseudo science. “They don’t prove any laws.”
Epidemiology is supposed to be used as a starting point for where to look for a health problem, not as proof of the problem. Like models in the aerospace industry, epidemiology is a powerful tool when used within its limits. The problem now is people take it as a gospel truth rather than an indication that there is a root cause to look for.
It goes hand in hand with the current fad of conflating correlation with causation.
“50,000 people DIE of secondhand smoking every year”. I am not now, nor have I ever been a smoker, but this repeated statement has -0- basis in FACT. More statistical ju-jitsu and mumbo-jumbo. Show me the coroner’s reports. Show me the medical diagnoses. Go ahead, stack them all up in front of me, and then I will review each one to determine just how “loose” one’s definitions are when inventing a really scary slogan. You repeat the lie often enough … and soon the whole world says Heil Hittler!
Clymate scyentists show a correlation between breathing and death
So by mixing all sorts of statistics, you make poison into antidote.
Good one.
Why is there no change in life expectancy with the significant decrease in smoking since 1990?
usurbrain,
Giving an accurate answer to your question is currently forbidden in polite society. The fact is that all those supposed smoking deaths were apparently calculated with computer models. Some analysis was so bogus that a death of anyone who had smoked at some time in their life was counted as a smoking related death, even if that person was run over by a truck. Most of smoking related research makes climate research look good by comparison. Of course, I doubt anyone will bother to check the truth in that. Smoking certainly must be bad for us but the actual science behind it is buried under decades of speculation, innuendo, and studies of other studies.
Interesting that you say that as I am a smoker and have a cough and would be told by a doctor that ir is from smoking and yet I know ir is from black mould.
My grandparent died at the age of 95 and smoked all his life cigars and my father in law smoked 2 packs of cigarettes dronk wine and whiskey and died at the age of 86.
Does that prove whiskey is bad for you and knocks 9 years of your life?
Nope.
There IS an increase of life expectancy since 1990.
Insurance companies, who depends on reliable statistics to make their living (so i trust them more than health institution), consider you higher risk if you smoke, but not if you quited smoking 10 years ago.
Smoking is supposed to substract 25 years from your life. alcohol is supposed to substract 10 years. hard manual work, 5 years. Add pollution, chronic disease like diabete, etc.
Obviously their are double counts, so smoking reduction accounts for something, but not as much as to obviously show
paqyfelyc – November 29, 2017 at 4:19 am
There is NO reliable statistics on cigarette smoke’s association or correlation with injuries, sickness or deaths ….. because cigarette smoke is not the culprit that causes the aforesaid.
And in actuality, insurance companies really don’t consider cigarette smokers “high risk” …… but they sure take advantage of the fact that others do …….. by charging smokers a higher Premium than the non-smokers. Free money is “free money” and they won’t turn it down .
Ells bells, drinking alcoholic beverages is far more dangerous to one’s health than is smoking cigarettes, …… but insurance companies don’t even ask if one drinks alcohol, let alone demand they pay higher Premiums for their policy.
Alcohol danger depends on the consumption. Abstaining is worse than moderate drinking.
http://www.wired.co.uk/article/why-alcohol-is-good-for-you
Shur nuff, …… Nigel S, ……. cane sugar (sucrose) is just two (2) chemical action away from being drinking alcohol (ethyl) …… to wit, cane sugar to ethyl alcohol and CO2.
A C12 alcohol (CHO) to a C6 alcohol to a C2 alcohol
C12H22O11 → 2 C6H12O6 → 2 C2H5OH + 2 CO2
Seems I am dead!!!
usurbrain – November 28, 2017 at 7:30 pm
There are two (2) excellent reasons why.
1. Cigarettes are a fantastic “cash cow” for state/federal government(s) and dozens of “troughfeeders” in the private sector who enjoy all that “free money” that is extorted from those who purchase cigarettes and/or tobacco products. As well as all the “drug addicts” whose medical bill are paid for out of cigarette tax monies. And state employees which cigarette tax monies are prerequisite for their employment and salaries paid.
2. There is absolutely, positively, no scientific evidence that “cigarette smoke” causes death(s) of humans. NONE, NADA, ZERO, ZILCH.
But of course one could claim that …… cigarette smoke got in the eyes of a person, temporary blinding them, and he/she crashed their vehicle, killing themselves or someone else.
There are no Death Certificates that lists “cigarette smoke” as the cause of death.
Anthropogenic Climate Modelling computer programs are FAR, FAR, FAR more accurate and reliable than any of the ….. Deaths Caused by Cigarette Smoke Modelling computer programs.
Samuel,
Isn’t there strong evidence of heart disease due to nicotine? My understanding is that the lung illness threat is vastly overstated (and over hyped) relative to the threat of heart disease…which is much easier to draw a causal link to. (But maybe I’m not remembering the information correctly.)
Note, as someone who enjoys cigars, I’m not totally unbiased…
rip
Ripshin,
I have no doubt that there is plenty of strong insinuations, associations and/or correlations of diagnosed heart disease due to nicotine derived from cigarette smoke ……. but I am not aware of any actual, factual evidence that proves nicotine is a direct cause of heart disease.
Now the literal fact is, if one has a lung or breathing problem, (cancer, RA, emphysema, black lung, white lung, etc.) then cigarette smoke, like many other things, is likely to antagonize and/or exacerbate that problem.
Likewise with heart disease and nicotine
Ripshin, …… just ask yourself, ……. iffen cigarette smoke has been scientifically determined to be the direct cause of eleven (11) different types of cancer, ….. why is it that Trial Lawyers have only ever sued on behalf of “lung cancer” patients?
“There is absolutely, positively, no scientific evidence that “cigarette smoke” causes death(s) of humans. NONE, NADA, ZERO, ZILCH.”
Of course there is. But hey, Fred Singer would be proud of you.
https://www.cdc.gov/cancer/lung/basic_info/risk_factors.htm
What an interesting post!? Ad hominems slung falsely at Dr. Singer and a claim based on something the CDC support.
From chris’s cdc link.
In response to: Chris – November 29, 2017 at 9:45 am
Those who are avid “troughfeeders” on the Tobacco Settlement monies and the Tobacco Tax monies will do their damnest to preserve their “seat” at the government trough ….. and will avert their eyes and mind to the real science concerning cancer(s), to wit:
AtheoK said: “If the cause was exactly established, the CDC should be able to explicitly define which chemical brew caused which cancers.”
By your logic, let’s just stop all health research. Because, you know, you can’t look at things in complete and utter isolation. So, for example, research that shows that a diet high in red meat leads to heart disease? Nope, it might be the air they breath, or something in the water they drink, or the broccoli they consumed alongside the red meaat. Let’s just shrug our collective shoulders and say “who knows”?
Samuel C Cogar: So your refutation is a paper based on models. Interesting – when climate scientists use models, you call that rubbish. But when it is done for cancer you’re totally ok with it. In fact, you say: “Anthropogenic Climate Modelling computer programs are FAR, FAR, FAR more accurate and reliable than any of the ….. Deaths Caused by Cigarette Smoke Modelling computer programs.” Hypocrite much?
Oh, and the article you posted concludes: “Though most cancers are due to bad luck, people should not ignore sound public health advice that can help people avoid preventable cancers, including maintaining a healthy weight and avoiding environmental risk factors such as smoking, the team said.”
So even your own chosen research says that smoking increases the chances of cancer.
Chris – November 30, 2017 at 7:52 am
Chris, …… did you post the above fecal rubbish for the sole intentional purpose of irritating me …… or are you really a learning disabled, miseducated, brainwashed young adult with a severe case of extremely poor reading comprehension and incapable of thinking for yourself ……. and thus the reason your posted commentary is chock full of mimicry and plagiarisms that you are oblivious to their root meanings?
”DUH”, I cited no papers on cancer studies that were based in/on “computer modeling programs”.
And Chris, …….. GETTA CLUE, ……. my statement denoting “Deaths Caused by Cigarette Smoke Modelling computer programs” …….. was in reference to the “process” that government agencies (CDC) use for calculating the “number of deaths attributed to cigarette smoke”, such as, to wit:
Chris, where in hell do you think the CDC is getting those “yearly cigarette-smoke related death quantities”, ……. perhaps from tallies made by you and your friends while out there running around America counting all the corpses with nicotine stained fingers and/or the smell of cigarette smoke on their body or in their hair?
Chris, you don’t/didn‘t have a clue where or how those “death statistics” originated ……. and it matters not to you because it is unimportant to the success of your “PC agenda”.
“At least 70 are known to cause cancer in people or animals.”
I want to know where all these animals who smoke are hanging out… how old does your dog have to be to purchase cigarettes… is that why used cigarettes are called “dog ends”
Have computer/spellcheckers reduced the deaths related to tipex?
Do more people die of cancer today because they are living longer…
But seriously if you are worried about cancer and cigarettes smoke Ganga and you just won’t care!!
Gun deaths and opioids. The latter apparently being the leading cause of death in americans under the age of 50
Tonyb
Why is there no change in life expectancy with the significant decrease in smoking since 1990?
Because you can die of other things than lung cancer?
The real question is, why are we not living longer?
Heroin
Because frankly with what is going on today, most people give up the will to live….
Because the normal worker works 45 years. That is to long. If the normal worker were a politician or a Hillary or a trump, he would probably wish to be the american president at 70 years. But he is not in that upper-class of non workers.
Because medical research has been going down dead ends. Until it starts understanding how diet affects us we will continue to have an epidemic of diabetes and auto-immune problems.
Because it takes 40 years on average before smoking kills you.
“Yup”, ….. and the same with heart attacks, ………. so what’s your ’40 year’ point suppose ta prove?
Who says there is no change in life expectancy? The graphs in the post say LE (the green line) grows.
Because of the rise in obesity rates and the diseases it leads to.
Anyone that thinks breathing particulate matter from combustion doesn’t shorten human lifespans has a very skewed sense of reality. This study was a complete waste of time and money, and draws inferences that are simply not supported by facts.
To do this properly, you would have to have such studies done worldwide where there is NO such pollution, but near places that do have that pollution. That is, some places are naturally more healthy than others, so you can’t just compare polluted locations, you must compare unpolluted locations that are very near polluted locations so that you can attribute the difference to the pollution.
And then, you would have to take into consideration that we exhale CO2, and it is only identified as a pollutant by a very political designation by the EPA – it is not a pollutant, it is a natural gas required to support plant life and exhaled by all mammals.
The moment this report tried to connect CO2 to actual combustion particles as a cause for human death, the real objective was revealed – that CO2 is bad, and this would be just one more strike against it. With that unveiling, it means the rest of the report is in serious doubt as well because the experiment is in doubt to start with. If you have a bad experiment, you will get bad results.
John…….
Huh? Did u read a different article than I did? The article concludes that economic activity and rising wealth brought about by industrialisation as indicated by a progressively increasing GDP results in better quality of life, less health issues and a longer life expectancy, oregardless of the increase in PM 2.5 level or CO2 level in the atmosphere. In other words, this article contests the current MSM scare propaganda against pollution resulting from industry and hydrocarbon fuels, in general. I fully agree that we are living in a much cleaner world than the one in which I grew up and the minor pollution resulting from diesel and other hydrocarbon use is largely irrelevant when compared to the life improvements and benefits from their use.
because we are living in a cleaner
world than you grew up in hardly means
pollution does no damage. this
should be self-evident. what does a
“cleaner world” mean anyway, if not
less pollutants?
ps – many factors determine life
expectancy. this post’s fault is that
it ignores everything else.
Statistically life expectancy has been increasing in developed and developing nations for decades.
What gets forgotten by all the econutts is all that technology creating the pollution also created that effect.
The usually stupidity econutts try is to separate medical advances out from technology as if we would have made all the medical advancement without the technology.
Certainly, one thing that lowers life expectancy is lack of food.
And that food comes only from the combination of CO2 and H2O.
Anyone who is suffering from e.g. COPD as a result of a lifetimes smoking will tell you instantly that constant inhalation of pollutants not only reduces life, but turns the last few years of it into a living hell.
Death rates are not the only thing that matters: Quality of life is extremely important, and if it drops below a certain level, suicide becomes the cause of death. There is an abnormally high rate of suicide associated with COPD as well as heart disease and heart failure. They render life not worth living.
Crackers345…..
Ha! Ha! Ha! You guys are “crack me up” – pun fully intended! When you say “it ignores everything else”………..that’s a pretty dumb comment! Epidemiology is always difficult due to the many confounding factors involved in individual lifestyles, genetics and environmental factors. However, you would have to be completely out-of-touch with reality if you didn’t recognise the enormous improvements in the human condition that have accumulated since the onset of the industrial revolution. That revolution was driven by technological progress, science and, most importantly, access to cheap energy in the form of hydrocarbons. It transformed grinding poverty, a subsistence agrarian existence with a short average lifespan and very high childhood mortality rate into the world we live in today. There are many confounding factors in this gross simplification (better medicines, less hard labour, better education, etc. etc.) but the single dominant factor that drove all other changes was industrialisation, mass production and the resultant improvements in productivity and, as a direct result, wealth of the average citizen.
The world is cleaner today than it was 50 years ago and it’s getting cleaner all the time because we have the money to spend on keeping it clean and enforcing control measures, where necessary. Burning wood in a dark hovel to cook your dinner was never likely to be a good thing for you or your kids and it’s not good for the disadvantaged people who still have to do it. I’d like to know why you misguided folks are hell-bent on denying another 1 billion human beings the opportunity to improve their lives by having access to the cheap energy resources they need…..and, of course, consigning the rest of us to a return to the dark ages.
German study back in the 1980s said that noise and light at night counted for far more reduced life expectancy than pollution.
But then I doubt death by asthma and acute toxicity, cancer and suicide were actually included in the study.
Perhaps a better graph showing the incredible decreases of REAL US air pollutants just since 1980 is EPA’s air-quality trend data:
https://www.epa.gov/air-trends/air-quality-national-summary
Carbon Monoxide: down 85%
Lead: down 99%
Nitrogen Dioxide: Down 62%
Sulfur Dioxide: Down 87%
PM 2.5: down 31%
Almost all Leftists think US air quality is getting worse and worse….
Not so much…
When I show Leftists this EPA data, they often say the EPA data was bought off by….. Big Oil….
Leftists are so silly and brainwashed…
sorry, but the “science” in this
post is naive and ridiculous. you
don’t do epidemiology by just looking
at a couple of charts.
But don’t worry, there will be about 50 Watters that will be defending in all night…
And you don’t do “climate science” by just looking a tree ring data from dataset of 12 trees and just choosing 1, YAD061, to generate a hockey stick temperature graph either. Oh wait…
“sorry, but the “science” in this
post is naïve and ridiculous.”
You always describe your posts so well.
And yet you couldn’t find one thing wrong with it that you could specify. Sorry, crackers345 but there is one word that describes your comment …….. denial.
“And yet you couldn’t find one thing wrong with it that you could specify.”
Gee, how about the fact that life expectancy in Delhi has declined by 6.4 years. It took me all of 10 seconds to find that.
https://scroll.in/latest/809501/life-expectancy-in-delhi-has-reduced-by-six-years-because-of-air-pollution-reveals-study
“Although these results are in line with other global estimates, such as the World Health Organization and the Global Burden of Diseases, there’s no physical way to tell who has actually been killed by air pollution,” IITM scientist Sachin Ghude admitted.
This one says life expectancy increased 6.9 years for men and 10.3 years for women in the years between 1990 and 2013, take your pick.
http://www.livemint.com/Politics/76VBKHvKhzvK3V8rLySVmN/Life-expectancy-up-in-India-but-people-living-longer-with-i.html
@ Chris…the rapid growth in population likely has much to do with why life expectancy dropped for Delhi. Looking up some numbers for the area shows that the population grew from 400K in 1901 to 19 million by 2011. Since 2011 the population has surged to 27 million, eight million more in the last 6 years. There is no way that Delhi can adequately care for the needs of the population with such a massive growth rate of very poor people.
richard, the flaws in this post are
so obvious i didn’t think i needed
to point them out.
others here have explained them
well.
Nigel, your data is for India, mine is for Delhi.
+100 Exactly the point! : ]
“[Note that China’s life expectancy declined toward the beginning and end of the 1960s. This was probably because China still had not conquered hunger and food supplies per capita were consequently low.]”
No, this was because the Chinese government was communist. In an orgasm of Marxist hubris, Mousy Dung created first the “Great Leap Forward (1958 to 1963) and then the “Cultural Revolution (1966 to 1976). They didn’t conquer hunger because they were too busy creating it with their insane Leftist policies.
“Millions of people were persecuted in the violent struggles that ensued across the country, and suffered a wide range of abuses including public humiliation, arbitrary imprisonment, torture, hard labor, sustained harassment, seizure of property and sometimes execution. A large segment of the population was forcibly displaced, most notably the transfer of urban youth to rural regions during the Down to the Countryside Movement. Historical relics and artifacts were destroyed. Cultural and religious sites were ransacked.” –Wankerpedia
Millions died for no reason other than Communist zeal. Communism sucks like a fruit bat on a mango.
Arguably they would have died anyway.
The Black Death was what allowed social change to begin, in Europe.
Megadeath is always good for the survivors – look at post war Germany.
My favourite Chairman Mao cartoon.
http://vps.templar.co.uk/Cartoons%20and%20Politics/Fat%20Freddies%20Cat%20and%20Chairman%20MAO.png
that was a blast from the past, eh?
i have fabulous furry freak bros comix here. subculture classics.
i don’t have any Zap
but somewhere i have Principia Discordia.
Ha-ha. Animal abuse is always sooooooooooooo funny! /s
Megadeath is always good for the survivors – look at post war Germany.”
Where’s the sarc tag? Yeah, look at post WWI Germany. Starvation, inflation, unemployment, and, soon, National Socialism, Hitler, and Holocaust.
it’s because China was
totalitarian then.
“can the NYT be trusted?”
Only if you take the opposite of what they say.
“The New York Times” can be rearranged to spell “The monkeys write.” Coincidence? Or cosmic joke?
Ah, As in Kipling’s Bandar Log
“We all say it, so it must be true”
Throughout the article there is an assumption that ‘coal makes PM 2.5 if it is burned. This is untrue. PM2.5 is unburned fuel. Modern combustors, even small ones down to 5 kW, produce nearly no PM2.5. When read with this in mind, nearly every major point made about coal has to be adjusted.
Heat from coal provides adequate heating for hundreds of millions of poor people. It doesn’t have to provide smoke. Why are the poor denied access to modern stoves and boilers? It is merely a design issue.
“PM2.5 are particles with a diameter of 2.5 micrometers or less and a study recently found that a 10 µg/m3 (per cubic meter of air) increase leads to a 1.03 year reduction in life expectancy…”
This is simply untrue. The dose-response is highly non-linear. A rise from 300 to 310 would have no detectable effect on life expectancy. Not in a population of 1m people.
People claiming that PM2.5 shorten life seem unable to produce any evidence as to whether this is by 1 hour, 1 day, 1 week or 1 year. Seems to be based entirely on computer modelling and that will rely solely on the parameters and assumptions that are programmed into it – just as climate models do.
In the 1990’s the concern was all based around PM10 and it was only when cleaner burn engines and diesel particulat filters became the norm that the focus has shifted to PM2.5 …. interesting.
Old england
Engines and ‘diesel’ don’t make particles above about PM1.5 (1.5 microns aerodynamic diameter). The vast majority of particles from engines are smaller than PM0.1 so in that range they go by count rather than mass (as they have nearly no mass).
The PM10/PM2.5 story starts in the 1970’s and relates to the technology available at the time. PM2.5 was selected as a metric because there are basically no particles of that size produced, only larger and smaller. This makes it more likely two different labs will get the same result because being a little high or low on the size selection doesn’t change the calculated result.
It is very useful to raise the question (so much nonsense is talked in the MSM), and his conclusions could be right, but this article proves nothing either way.
The author makes the same classic logical error made by AGW enthusiasts of confusing correlation with causation. As someone once pointed out, this is like trying to prove that Presbyterian ministers in Nova Scotia drink too much because the salaries of said ministers and the price of rum in Jamaica track each other. Actually they are tied independently to a third variable. Epidemiology is difficult and this sort of thing drags WUWT through the gutter.
At last a sensible comment. It would be helpful if your post could be moved to the top if the comment section so people needn’t bother reading any further.
No, it’s the other way round. The author is merely showing that there isn’t a correlation between PM2,5 and gross mortality figures. He shows that other things are better correlated.
I’m quite prepared to believe that there is a connection between this kind of pollution and negative health effects, (“seems obvious, dunnit?”) but when the effect is small, and there are so many powerful confounding factors, extraordinary statistical leaps of faith are required to claim ‘proof’. I don’t buy Milloy’s whole package (agree he is far too selective in his evidence) but he does have a point when challenging how the numbers of ‘excess deaths’ are arrived at. I’m no statistician, but even I can see that the statistical methods claimed in many studies to eliminate the effects of all the very many other variables don’t really do so.
The secret, as always, is to be able to put all these things into some kind of perspective or balance, which is rarely possible in these days when risk tolerance is entirely absent. “If it only saves the life of one child..” or similar thinking invariably carries the day. The downside of acting against small pollutions is never part of the calculation.
As I said higher up, but perhaps worth repeating below as it seems impossible to reliably establish how many, if any ‘excess deaths’ there are – save that we do know that third world countries which are being denied reliable energy have multiple induced medical conditions which seem to lead to high mortality rates (caveat that infant mortality rates may be the driver of ultra-low life expectancy) caused by having to cook over wood or dung fires.
The point I made above was this;
Average life expectancy is a curious number that I first questioned when researching family history. Back in the 17th, 18th and 19th and early 20th centuries I found that most of my forebears died in their 80s or 90s with a number reaching a few months short of 100 years.
I couldn’t square this with the accepted figures of lifespans of 45-55 years as being the average lifespan in those periods until I looked at how many children died in infancy, before the age of 1, 2 or 3.
Then it became clear to me that one of the biggest factors in Life Expectancy is infant mortality. If adults have an average lifespan of 85 years (as was roughly the case in my family) But infant mortality is around 30% to 40% then of course the Average lifespan would fall dramatically down to figures of around 45-55 years.
I suspect that medical care hs improved in many parts of the world and that has a significant part in increasing life expectancy.
It is the third world which is being denied reliable energy that suffers the highest levels of infant mortality and thus has the lowest life expectancy rates.
The best evidence for PM2,5 mortality comes from studies of ‘high pollution’ events – usually weather related – and increased hospitalisations/deaths over the next few days. Not entirely clear what that means for overall life expectancy, and methodology has been challenged, certainly, but it would be churlish not to recognise the likely causal relationship between the two. A West London study is often cited, but there are others.
Mothcatcher and Old England
There are additional factors affecting the actual risk of premature death (compared with an estimate of risk) but everyone will understand that intuitively. One must carefully parse what the word mean.
Attributed to a disease is not caused by.
Attribution does not mean avoidable.
Contributing to a premature death is not caused a premature death.
Premature deaths attributed to multiple causes of have to be generated statistically and thus are part of the field of Public Health, not Medicine where different standards and attitudes apply regarding ’causes’.
People who die ‘postmaturely’ were also exposed to these same risks. Thus the meaning of a ‘mature death’ should be questioned. At present it is 86 years old.
At the root of many claims is the unsupportable assertion by the EPA that all particles have the same effect on the human body, the ‘equitoxicity’ claim. They said they can make this claim because they ‘do not have proof it isn’t true’ or words to that effect. All the claims that this or that contribute to premature deaths, often mis-quoted as ‘causing deaths’ are based on the equitoxicity decision. This applies to the EPA, GBD and WHO documents on the topic.
It is obvious that smoke inhalation is objectional on multiple grounds, but to make specific claims about a person means having to know their gender, age, diet, health status, vaccinations, income, local environment, education and genetic predispositions. With that one can start making medical claims.
Something that may not be obvious immediately is that even if there exist reasonable populations statistics attributing risk, it is not possible to claim that completely removing PM2.5 from someone’s life with lengthen it by a calculable number of months or years. That is jumping from the public health domain over to making a medical prediction for an individual. These life extensions are known as aDALYs (avoided disability adjusted life years) and you are likely to see them being ‘traded’ soon for real money.
In the UK we are all aware that the BBC is a purveyor of fake news, hence the saying “Is that true or did you hear it on the BBC?”
Phil in all fairness I think it would be fair to add “on some subjects”. They have a formal institutional bias on climate change but they are generally reliable on things like the details of the budget
But they are getting less reliable on some things. Tne announcers are getting very bad at spotting obvious mistakes, like saying the queen was married in 1937 on a recent “Newsnight”.
Also there is an awful lot of speculation by “experts”, like what will be in the budget, before the budget, instead of waiting to see what is in the budget.
Reliable but with a lefty slant is more accurate.
Reliably lefty slant, there – all fixed for you.
SteveT
QV raises a very important issue – the rise of the BBC EXPERT. So often news stories are short on facts and so its now its ‘over to our XYZ correspondent to interpret this for you’ and this interpretation often is the major part of the report. They acquire a towering authority because they are controlling the information, and that is very dangerous indeed. Nowhere more stridently demonstrated than in Climate Science reporting, but also setting the agenda increasingly on most subjects.
I notice ITV and other channels are using similar tactics.
I am sure it’s not just the BBC, it probably originated from the USA.
But one expects better from the BBC!
I would reduce the licence by 5% every year and make them get rid of some of the “talent”.
All the BBC news and discussion programmes seem to be stuffed with Guardian contributors to the extent that I marvel at the Guardian’s ability to produce each day’s issue. Note I deliberately did not use the word newspaper.
SteveT
Koch funded Berkely Earth fake graphs may shorten a lifespan or two, maybe by the end of the century?
Yes, every other things being equal. But even when other things compensate the life expectancy, your quality of life undoubtedly suffers with pollution.
The problem is that every other thing is rarely equal. We wouldn’t be having this conversation now if our collective ancestors had been too worried about the smell of the smoke to recognise the benefits of heat, safety, light and other utilities (cooking) from the fire. So, some pollution is an inevitable consequence of accessing the raw materials we need to survive, whether those are minerals and ores, fuel sources (including oil, gas, coal, uranium….and wood), food, clothing, etc.
Most of the “pollution” we create is harmless enough, thankfully, and over the years we have identified the relatively small number of pollutants that are actually toxic and need to be addressed by proper industrial hygiene, strict disposal rules and safety considerations. As others have posted, levels of harmful pollutants have ALL been reduced over the past 50 years or so. Of course, CO2 is NOT a harmful pollutant and we are almost certainly doing the planet and its greenery a service by releasing the sequestered carbon from the geological repositories that locked it up for the past few million years.
We need to clean up the air around where we live, work and play. This means controlling or eliminating cars. The car is just all of us driving through places other people live, work and play, destroying their quality of life, while going somewhere else.
Industrial air pollution destroys neighborhoods. Traffic destroys neighborhoods too, in large part because of air pollution. Do you want to live next to the A12 as it enters London? Would you want to live on the side of any of the main roads in and out? Do you like the idea of living next to the Peripherique?
Of course you do not. This is vandalism on a huge scale, and we should be putting a stop to it. Not because of global warming of course. Because we should have more respect for each other.
People can produce all the stats they want about how air pollution does not shorten life. They did the same thing with smoking years ago, and one notices that some are still doing it here. The reality is that we have shown smoking causes both lung cancer and heart disease 50 years ago. Makes no difference. We are not trying to reduce noise and air pollution to increase life expectancy. We are doing it to live, work and play in nicer places.
Pride and pleasure in one’s neighborhood and wanting to have it be a nice safe place to be and bring up kids is entirely right and natural. Anyone starts defending air pollution on the grounds that the statistics on life expectancy don’t show it shortens life is missing the point totally.
Mr Goklany needs to move next to the Peripherique, or live on the London North Circular Road for a month. Then come back and tell us how he liked it!
That, it will turn out, is for other people. Its always other people who should put up with this crap so I can drive through to where I am going. We have to start saying no.
So Michel when are you giving up your car for the greater good?
So you don’t have to drive to work? I do. And the grocery store. Welcome to life muchacho.
I will not assume that michel drives a car. However, I will accuse him of hypocrisy.
If urban pollution is a problem for him he should move somewhere suffering low pollution levels, say the Scottish highlands or the Auvergne.
I suspect he will claim he needs city life for work etc. without acknowledging that cities create the level of pollution he complains about.
No-one is forced to live in a city, it is their choice. Most accept a small, low pollution level, almost unnoticeable most of the time in exchange for the advantages of city life (good selection of jobs, transport, theatres, restaurants and other services, entertainments etc.).
SteveT
None of this is any argument against cleaning up city air.
How we should do it? Ban ICE cars and trucks and buses. Electric only.
You all argue, no-one has to live in a city, so put up with it. I am arguing, no-one has to drive ICE, so put up with it. Yes, they cost more. No they are not as convenient. Get used to it.
Same difference, except the air will be cleaner and the streets a lot quieter.
Anyone who want to drive an EV is welcome to.
Just don’t try and force it on those that don’t want to.
and DON’T expect everyone else to pay for all the crap needed to support your decision.
Get your electric car, no subsidy,
Pay for your own electricity supply and all the paraphernalia needed.. no subsidy.
Just do it………… OR DON’T. !!
No, he should not move somewhere else. The law should prevent people from making individual choices that pollute the common air we all breathe.
This has nothing to do with individual choices. This is a matter of public policy. Its a matter of setting standards. Its in the same category as we do not permit the discharge of mercury into the environment. We regulate the use of pesticides. We have safety regulations in factories.
These are all things which we have collectively decided cannot be left to individual choice. Because that does not deliver what we want – in the present case, clean air.
it is perfectly consistent to drive ICE, because if everyone is doing it there is no real choice and it makes no real difference not to, but also to press for legislation banning ICE from cities. Its a question of what is effective. It is not hypocritical. Its simply adopting efficient and effective means to an end.
And so I say, the answer is not to tell people to leave cities if they dislike air pollution. The answer is to clean up the air. And if people do not like the measures the rest of us are increasingly voting in, in order to clean up the air, YOU move someplace else. You do not have to drive an ICE to the store. Get an electric car. Walk. Bike. You don’t want to, YOU go live somewhere else. It is your choice.
This article is utter nonsense.
why? Because it takes life expectancy across entire nations against industrial pollution. New York AND the Rocky Mountains, Florida AND Chicago.
The life expectancy of those in the most polluted areas drops: the overall life expectancy across the whole nation may go up.
It is utterly certain that if in a polluted city like Delhi, Beijing or the London of the 1950s that deaths from particulate pollution rise and that life expectancy of residents is lower.
Griff, if you look at reference [1] you can see that the life expectancy figures Dr Goklany quotes are already broken down by state. In the table “Statement 3” on page 5 of the pdf, “Delhi” (which presumably means the National Capital Territory of Delhi) shows a life expectancy of 73.2 years.
SteveT. I agree. I don’t see a problem in having a “too clean” environment. Even if asthma and allergies were partly a cause of that it probably would only be a step in the adaptation process with a resolution forwarded by genes to our descendants. The trial & error principle in the evolution is a mighty weapon once you have enough possibilities (human beings).
Griff: Just 2 examples from Germany: Munich & Stuttgart do have the highest pollution levels in terms of NO2 and particles. But both cities are #1 in the german statistics of life expectancy (Munich for females and Stuttgart for males). How do you explain that?
In my eyes life expectancy has nothing to do (anymore) with pollution, since the worst pollutants are already banned. It is mainly related to …
1. Quality and access to health care (incl. infant mortality!!!)
2. Personal wealth (nutrition, health care …)
3. Grade of personal liefe care (how we treat and care about our children and ourselves)
The human body is an adaption machine. It adapts to whatever environment. You might even lose adaptation capabilities if the environment gets too clean. The rise of Asthma and allergenic diseases might be the first symptons proving this hypothesis.
I agree with most of your comments and would like to add to your last paragraph. There is much evidence of a genetic link to the risk of suffering asthma and allergies.
Could the rise in these cases be partly as a result of more sufferers surviving longer and passing on those genes thanks to improvements in treating same? Early death would reduce future generations of sufferers.
I probably wouldn’t be around now without the development of adrenaline production etc.
SteveT
PS I don’t believe the “too clean” meme.
SteveT. I agree. I don’t see a problem in having a “too clean” environment. Even if asthma and allergies were partly a cause of that it probably would only be a step in the adaptation process with a resolution forwarded by genes to our descendants. The trial & error principle in the evolution is a mighty weapon once you have enough possibilities (human beings).
As usual, griff puts forward ZERO science, ZERO anything except brain-warped leftist propaganda nonsense.
ALWAYS.
I do not often agree with Griff, but yes, this is right. And the apologists for air pollution are simply nuts, and stupid with it. Or perhaps astroturfers.
One might want to also consider the reduction in infant mortality rates when comparing life expectancy from today to the past. I suspect it would have a significant part to play.
From the Economic Times (India) article quoted at the top of this post: a study recently found that a 10 µg/m3 (per cubic meter of air) increase leads to a 1.03 year reduction in life expectancy…
When I was researching for this essay here:
https://wattsupwiththat.com/2017/08/11/the-social-costs-of-air-pollution-from-cars-in-the-uk/
I found that the estimate (made by a committee called COMEAP in 2009) that the UK government was using for PM2.5 toxicity, considered over the whole population, worked out to a reduction in life expectancy of about six months for a 10 µg/m3 increase. In December 2015, COMEAP admitted that the 2009 figures had probably been over-estimated. Yet the figure given in the Economic Times (India) article is twice this!
It’s also worth inquiring what the error bars on this estimate are. In COMEAP’s 2009 estimate there was a factor of 12 between the highest and lowest estimates – from one-sixth of their best estimated figure, up to double that figure! Is this estimate any better? I somehow doubt it.
So Indur Goklany might want to add a third to his list of reasons why life expectancy goes up even in places where PM2.5 pollution gets worse. Namely, that (even if you accept the use of “statistical” deaths in the calculation) the real world toxicity of PM2.5 may have been over-estimated, perhaps by orders of magnitude.
If we assume a LNT dose effect, that would mean that the inhabitants of Delhi are, at 300 micrograms PM2,5 per cubic metre, losing between 15 and 30 years of life expectancy, and at 700micrograms recently reported, losing between 35 and 70 years of life. Even taking 300 as a ‘safe’ threshold (itself a high figure by most analyses) , the claim still looks absurd.
So, increased CO2 is directly correlated to increased lifespan!
Interesting idea, but provable with some experiments. But if you did prove it some idiot would say your research was faulty because it did not agree with their “computer model”!
Yes, the plants goes better and therefore also the humans as the top of the foodchain.
Poverty and cold shorten life spans. It is no surprise that hypocritical Green voters live in the most affluent areas.
Actually where I live the well-healed areas tend vote conservative.
Which I trust you to be true, but do not contradict Silver Dynamite’s idea (whether true or not, i don’t know) that the very same areas also make up most of the “green” vote while poorer area would vote “simply red” (not american red, of course: socialist’s).
Thank goodness there are some areas inhabited by sensible people.
Greens are almost exclusively well-HEELED, one has to be, to afford such a lifestyle.
SteveT
Another irrelevant article that takes a simplistic approach to a complex problem to draw wrong conclusions.
If you want to know the effects of air pollution on human health you have to look at the health problems it causes. The mechanisms of air pollution effect on human health are quite similar to those of tobacco, although tobacco is much worse. It causes and worsens respiratory illnesses and asthma, certain type of immune problems and certain types of cancer. If you look at the incidence of those problems then a very clear association comes up, as it happened with tobacco. The life expectancy of those afflicted by the increased incidence of these health problems is shortened. The life expectancy of the rest is not affected.
If you are one of the people whose life is severely affected by the increase in air pollution, that the general life expectancy of the population is increasing is no consolation. We owe to these people, that could include many of the readers of this article, regardless of their present opinion on the subject, the cleaning of our air.
I don’t see how this article adds anything to this issue.
I don’t know Javier. I still remember many years ago seeing the 90 year old men lined up outside the old age home smoking on the porch when I went to visit my grandmother. I also had a conversation with a 115 year old 30 years ago and the main thing he was upset about was that they made him quit smoking when he turned 105 and went to the home. On a recent trip to see my mother I saw the old men at the home still outside smoking but they now have to stand on the sidewalk. Remember smoking does not “cause” cancer but very slightly increases your chances of getting cancer. The key word is “slightly”. If it caused cancer every single person that smoked would get cancer and that is not the case. Where I live the air today is an order of magnitude cleaner than it was 50 years ago and yet many respiratory conditions are on the rise. Cause and effect are not that clear or well defined.
If you are 25, inhaling a witches brew of partially oxidized organic compounds is probably a poor idea. Not only is future cancer a risk, but eventual Chronic Obstructive Pulmonary Disease (COPD) is a very likely consequence. Spending your golden years dragging an Oxygen tank around doesn’t look like much fun.
If you are 105, the prospect of cancer of COPD when you turn 145 probably seems like the least o your problems.
I won’t bother answering the “I know somebody who lived past 100 and smoked” argument. If you don’t realize that it doesn’t constitute evidence that’s your problem.
Did you ever ask those 90 year old men lined up outside how many of their also smoking friends had died from cancer already?
The point is that they smoked all of their lives and were still alive. Most of them longer than their non-smoking friends. Wrong again Javier it is evidence that not everyone that smokes dies of cancer. I have seen the same in every old age home I have visited. I have been to quite a few since now I am visiting friends in the homes. Don’t get me wrong I am a reformed smoker, I gave it up 18 years ago. Still the anti-smoking lobby is worse than the warmists. Facts are optional and fear mongering rules the roost.
Javier,
The value of Dr. Golkany’s article is that it highlights the fallacious claim that air pollution statistics can be directly correlated to human death/health statistics.
The EPA routinely cites “x premature deaths prevented” or “y asthma diagnoses averted” in cost-benefit justifications for new regulations. The deaths to be prevented and asthma diagnoses to be averted can never be tested. The claims are entirely based on models. If air pollution regulations were having a significant impact on asthma, the prevalence of asthma shouldn’t have tripled while air pollution was being drastically reduced…
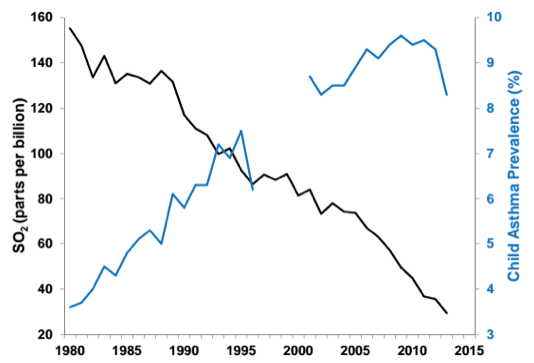
http://instituteforenergyresearch.org/wp-content/uploads/2015/07/Screen-Shot-2015-07-22-at-12.09.33-PM.png
http://instituteforenergyresearch.org/wp-content/uploads/2015/07/FIGURE-3.png
http://instituteforenergyresearch.org/wp-content/uploads/2015/07/figure-4.png
http://instituteforenergyresearch.org/wp-content/uploads/2015/07/figure-5.png
http://instituteforenergyresearch.org/analysis/five-charts-that-blow-apart-epas-asthma-claims/
https://wattsupwiththat.com/2017/04/03/the-misuse-of-asthma-as-a-justifaction-for-epa-rules/
This is not an argument in favor of air pollution. It’s an argument against the fraudulent use of unquantifiable health benefits to offset very real and quantifiable economic costs of environmental regulations.
say- have you run across any usa asthma mortality charts that can show the effects of the epa banning primatene (the only rescue inhaler that worked)?
i have pretty good google-fu but could not find anything useful.
I haven’t seen any studies on the effects of the banning of Primatene; which “worked” only if you didn’t use it very often. Frequent use led to a burning sensation in my lungs and a caffeine-like buzz. Although, it didn’t require a prescription and worked OK, if used infrequently.
I’ve had several different types of albuterol inhalers over the past 20 years and they have all worked very well, apart from one asthma attack in 2001 that sent me to the ER.
k tnx
i’d bet a dollar people died- attributable to climate policy.
i wonder why it’s so hard to find the data… hmm…
Asthma is a consequence of immune system excessive activity and we are increasingly exposed to artificial allergens. But if you have asthma, the last thing you need is having to breath highly polluted air.
I agree that I don’t want to breathe polluted air … And as an asthmatic, I am sensitive to highly polluted air, particularly indoors.
However, my lungs can’t tell the difference between 75 and 60 ppb O3; but my wallet sure as hell can tell the difference.
https://www.uschamber.com/issue-brief/ozone-national-ambient-air-quality-standards
Of course “tobacco is much worse” than ordinary air pollution, at the end of the day it is extreme air pollution – magnitudes above normal exposure levels.
Strangely, Australia and New Zealand are way up in the higher echelons of per capita asthmatics – is this all the pollution associated with sunny, fresh-air living we read about? Do you have an alternative explanation?
Your first sentence is very true with regard to levels of air pollution – lots of wrong conclusions.
SteveT
Javier on November 29, 2017 at 6:33 am
Asthma is a consequence of immune system excessive activity and we are increasingly exposed to artificial allergens.
Want to try throwing out a third totally unsupported statement? Always go for the trifecta.
Javier: If you want to know the effects of air pollution on human health you have to look at the health problems it causes.
Yes, absolutely. But in order to do that, you need to know how big are the health problems it causes. You have to look at them quantitatively, not just qualitatively. I certainly wouldn’t suggest that PM2.5 doesn’t cause some health problems. But the value of Dr. Goklany’s article is that it shows that PM2.5 isn’t the only factor in the mix. Unless and until we know how significant PM2.5 is in comparison with other health factors both positive and negative, I don’t think we can make sane and unbiased decisions as to what is an “acceptable” level of it in the air. And from what I’ve seen, quantitative toxicology isn’t exactly a settled science right now.
If, as the Economic Times (India) article quoted from above says, PM2.5 levels in Delhi really are 40 times the World Health Organization’s “safe” limit, then either there is some health factor or factors at work orders of magnitude more positive than PM2.5 is negative, or the WHO over-estimates (and, perhaps, grossly over-estimates) the real world toxicity of PM2.5. If the second is true, as I suspect it may be, then seeking to reduce PM2.5 even further, regardless of costs, doesn’t seem to me a very sensible way to go.
I disagree. This requires a bottom up approach. Looking first at the people that are being made ill by pollution, exactly as it was done for tobacco.
A top down approach concluding that a majority of people is not seriously affected is irrelevant. The right to health is a basic human right.
The right to health is NOT human right at all, no more than the right to live. Being sick and dying is part of human life. Justice will hurt or even kill you if it see fit, no human right opposes that.
Basic human right is just to not be poisoned by other anymore than you yourself poison others, and we somehow have to agree on the level of each other poisoning we tolerate. The said level just cannot be zero, since you yourself produce poison, PM, disseminate virus, etc just by living.
So we somehow agree on the level (are levels, as this can depend on the place, time, …) we are going to tolerate (preferable with rational thinking and cost-analysis reasoning, but rarely so), even knowing that the said level may be too high for the health (or simple convenience, a perfectly admissible reason) of some people. It is then up to those people somehow lower their exposure, with equipment, change of habits, moving elsewhere or whatever.
This work for PM just like it work for every other inconvenience (sound, smell, or whatever).
Some things are easier than others. Tobacco was an easy target (probably quite rightly), it was a slam dunk with the number of known toxic compounds in quantities – magnitudes of levels above ordinary air pollution. It was relatively easy to show short-term harm, not so with air pollution.
There is much slimmer evidence for air pollution causing specific illnesses. I myself am asthmatic but reserve judgement as to it’s cause. I accept air pollution can aggravate my asthma (I’ve had to move position on a beach because somebody was smoking some 20 metres away). Also fungus spores seem to be one of my asthma’s main triggers.
Many pollens and spores are PM2.5 or less, how do we deal with them?
SteveT
paqyfelyc: Basic human right is just to not be poisoned by other anymore than you yourself poison others.
Beautifully put. Imposing costs on others, that bring them no benefit, is just as bad as poisoning them.
15th July 2001 Prajashakti a daily news paper run by CPM party, on their request I presented a review on a book published by John Belami Faster titled “Ayyo Earth: Environment–Revenue history” — in fact the review is in Telugu as the book was translated in to Telugu [English title may be not correct!]. This evaluated the relationship between environment and Social conditions — present and expected future conditions based on the industrialization and agriculture.
In another article relating pollution, the life span increases with the reduced deaths with the modern medicine. The modern medicine keeps the life longer unlike traditional system with more child mortality. Yet people have good health then and now live on medication spending major part of the income. In this two major players are pollution and liquor.
Dr. S. Jeevananda Reddy
While I agree that modern medicine almost certainly lengthens average lifespan and that the statistical treatment of air pollution is,at best, dubious, I’d submit that there is fairly solid evidence that sufficiently bad air can be lethal. Denora, PA 1948 https://en.wikipedia.org/wiki/1948_Donora_smog, London 1952 https://en.wikipedia.org/wiki/Great_Smog_of_London. Moreover, I think it’s reasonable to assume that there is a ramp up toward the fortunately rather rare headline grabbing conditions that cause substantial numbers of people to sicken and even die when the smog turns lethal.
Just because you can’t quantify something, doesn’t mean that it doesn’t exist.
Rich countries clean up their air (and water). IMHO, California, crazed though their current energy policies might be, deserves a lot of credit for cleaning up what passed for air in the LA Basin in the 1960s. With precious little support from the rest of America I might add. For developing countries it’s a trade off — industrialization now vs pollution that will have to be cleaned up later. It’s their choice how much pollution they allow.
It is upsetting when science descends into trivial ‘marketing’ speak so we now hear people being told they ‘do not believe in climate’. This article, and as far as I can tell almost all the comments, have fallen into the same trap laid by people who do not wish their work to be replicated and tested, as science is meant to do.
We are told repeatedly in posts above that PM2.5 are the problem or, from the lead contribution:
Indeed the EPA once claimed that PM2.5 were fatal.
Both statements are deliberately imprecise. Note none of the claims state what the particulate matter is merely that particles of that size are dangerous and reduce life expectancy.
Go to Engineering Toolbox: https://www.engineeringtoolbox.com/particle-sizes-d_934.html
Tabulated there are particle sizes in microns. PM stands for Particulate Matter and the number is the size of the particles in microns.
In the table you will find that face powder has particle sizes including “PM2.5” as does talcum powder. I suggest that along with diesel cars the Mayor of London should ban cosmetics that include face powder as he is obviously unconcerned about the lives of those that use cosmetics and similarly unconcerned with the health of babies and people using talcum powder. The same applies to all the regulatory authorities who appear to choose which industry they will attack.
These false claims dressed up in pretend ‘science’ like ‘climate change’ are being used by people with other agendas. Science would be precise and detail the particular constituents of particulates that are dangerous, in what way they are dangerous and provide a mechanism by which they are dangerous together with experiments set out to falsify the hypothesis that they are dangerous. Scientists would then repeat their own tests and attempt to replicate the falsifications.
Instead we get ambiguities such as PM2.5 are dangerous which is equivalent to do you believe in climate?; together with a set of bandwagons for politicians and marketing to leap on to get power and money.
nice job, Ian W
+1
You would add that the mayor of London would begin to mind his own business, that is, subway PM level
Generally, why do most husbands die before their wife?
Because they want to.
an old joke:
her :” what awful man you are. If I were your wife, i would brew you poison”
him: “If I were your husband, i’ll drink it on the spot”
A short recent review, only the abstract is available:
“Air quality environmental epidemiology studies are unreliable”
http://dx.doi.org/10.1016/j.yrtph.2017.03.009
thanks. another instance of “most research finding are false”
http://journals.plos.org/plosmedicine/article?id=10.1371/journal.pmed.0020124
“a recent study showed” is the usual sign that BS lies ahead.
Life expectancy and air pollution doesn’t seem to have any correlation in the UK….
https://www.ons.gov.uk/peoplepopulationandcommunity/birthsdeathsandmarriages/lifeexpectancies/bulletins/lifeexpectancyatbirthandatage65bylocalareasintheunitedkingdom/2014-04-16#local-area-life-expectancy
and yet supposedly 9500 extra deaths in London alone from air pollution….
https://www.theguardian.com/environment/2015/jul/15/nearly-9500-people-die-each-year-in-london-because-of-air-pollution-study
Life expectancy isn’t only related to air quality. Socioeconomic factors are more important overall. London is largely rich for example.
2.5pm may be considered the most dangerous pollutant, however the evidence that actually shows this to be the case is weak at best.
The general problem with epidemilogy that wants to establish a causation relation between pollution and mortality is the fact that nearly none of the studies can effectively measure the real pollution the group of people is exposed. So what they are doing is taking the measurement from a central measuring station in the relating town or area. Then they are calculating the pollution of every single person in the study by a computer model (LUR, land use regression). You can imagine the uncertainties in the range of several 100% of these results, depending on weather, temperature or just buildings/trees or whatever standing there. Still, this only means that the calculated pollution is supposed to happen at the front door of a single house. It does not mean that the man who lives in the house is exposed to it. He can drive a car every day to his office 50 miles away from his house and work there. So add another 100% or 200% uncertainty.
At the other side of the calculation the epidemiologists use another computer model to estimate the expected normal death rate of a specific area by taking age, sex, education, income and other social factors into account. This isn’t always done individually but estimated over large groups. So also add another huge uncertainty there.
Then they divide the two death rates, the real one and the expected one and plot it over the calculated pollution to arrive at the relative risk. Doing this for many areas with thousands/millions of people gives you a nice plot, especially when you have different computer models to chose between to achieve the intended result. At the end of the day they arrive with a conclusion that e.g. each 2 µg / m³ more pollution results in 5% more deaths. With uncertianties in the 1000% range
Go to William Briggs and see what this all about:
http://wmbriggs.com/post/8108/
http://wmbriggs.com/post/4353/
http://wmbriggs.com/post/16719/
http://wmbriggs.com/post/8720/
http://wmbriggs.com/post/4587/
http://wmbriggs.com/post/4857/
http://wmbriggs.com/post/3702/
or see the report of Panullo et al. who demonstrated that the result of a scottish study regarding NO2 could change from 5% to nearly zero by just changing the LUR computer model.
http://www.sciencedirect.com/science/article/pii/S1877584515300289
I think that this article mostly indicates that PM2.5 is not the largest influencer in life-expectancy.
I always remind people who are depressed about our non-organic foods, and toxin infused prepared food, that our life expectancy is higher than it has ever been.
“In Delhi, people could live as much as nine years longer if India met WHO standards”
If they live up to WHO standards, I’m moving to Delhi!
In Delhi, for that matter in northern parts of India, weather plays the havoc in winter. During this period cold waves frequency and direction changes the impact of pollution. In 70s I prepared a pollution potential index based on temperature inversion layer height and wind roses [direction, speed].
Dr. S. Jeevananda Reddy
“The best evidence for PM2,5 mortality comes from studies of ‘high pollution’ events – usually weather related – and increased hospitalisations/deaths over the next few days. Not entirely clear what that means for overall life expectancy, ….”
Or it is just the weather events.
We were on vacation sailing and sleeping on our boat. There was a heat advisory. I decided we should check into a hotel and enjoy A/C because of my wife’s chronic heart condition. My wife has a history of not telling me about how she is feeling. I asked her if I needed to take her to the emergency room. NO!
Thirty minutes later I am running traffic lights to get her to the ER. The first of her siblings to have stints put in.
The air quality was perfect.
I have looked at the Harvard studies. Her ER visit would be ‘evidence’ if the air quality was bad. However, ‘premature death’ was the very old with chronic health issues.
If you want to prevent a problem from reoccurring you find the root cause. For example, does a fall cause a broken hip or does a broken hip cause a fall?
My wife’s grandmother never recovered from a broken hip in her 90s. My wife’s mother never recovered from the heart attack following hip replacement surgery in her late 80s.
The point here is that each of us is an individual. Statistics are sometimes useful in making individual choices.
Statistics are also useful to manipulate society. I am waiting for the EPA to look at the statistics and tell congress that they have a done a good job and now their budget can be reduced by 90%.
Now imagine we would live to be 200 years. We would at least have to work until the age of 150 (or more) to pay for our retirement not counting inflation.
Beijing and Shanghai are NOWHERE near the worst air polluted cities in China, but they are the richest.
However as the author well knows, the difference in life outcome living in Beijing compared to say Auckland isn’t life expectancy per se, but life in good health, which is decades less than western cities.
https://www.bloomberg.com/view/articles/2014-06-19/why-living-in-beijing-could-ruin-your-life.
An article from Bloomberg? That’s just another arm of the marxist NYTimes. LMAO
With any numbers or stats other than sports scores? LMAO
This article is also being discussed over at stoves@bioenergylists.org where Nikhil writes:
“He is on the wrong track asking, “Are aggregate data on life expectancy consistent with such claims?”
There are only aggregate ESTIMATE of life expectancy at various ages by cohort (a hugely political issue) and in turn developed from something called Life Tables.
If you ask WHO and public health folks how Life Tables are developed, there are stories about that too. Read up WHO report on Causes of Death, Jan 2017.
Much of his analysis after that is the same problem as with the claims he is trying to dissect – associations are associations, attributions depend on methods and allocation, and above all, these are population (or cohort) level indicators (life expectancy or pollution in the way he chooses to describe). His claims don’t stand up to scrutiny either; he simply does not understand.
Then he writes “Finally, some may argue that while PM2.5 may not reduce life expectancy, it may actually make the population sicker. But this argument fails scrutiny.”
He fails there too – mixing apples and oranges. Yes, he finally recognizes his error in part – “Life expectancy is based on data on real births and real deaths, whereas the mortality effects of PM2.5 are based on “statistical” deaths or, to use a term currently in vogue, “fake” deaths.[9] ”
This is outrageous. “Statistical deaths” are not “fake deaths”. The man is simply ignorant, buying the rightwing ideology that seeks to attack the leftwing environmentalism.”
Nikhil continues at bionergylists.org
“All aggregate statistics have to be considered in their context of i) computation method and ii) the interpretation assigned to the definitions of underlying data.
That, in a way, is my general complaint against many such estimates and reporting of estimates as “data”.
It is true of things like “markets” and “prices” as of “global mean surface temperature” as of “greenhouse gas emissions” as here “premature deaths”, “HAP exposures”, and the Integrated Exposure Response. It is only when I dug into the original sources and debates surrounding the concepts in this last instance that even as I railed against them, I was able to forgive those who abuse the concept and derive politically convenient claims from deliberately ignoring what the definitions and the methods are.
Steve Milloy was an advisor to Scott Pruitt in re-organizing the EPA. Milloy is seen as a rightwing hack because of his attacks on the PM2.5 theology. I hope there is a thorough re-assessment of how PM2.5 – which is after all, only an indicator of pollution, NOT pollution itself – under Pruitt’s EPA and the newly reconstituted Science Advisory Board. Tony Cox, Jr. whose review concluded that there is no basis for finding causality between PM2.5 exposures and premature mortality, is one of the new members.
Milloy’s “Where are the bodies?” is tendentious, but he is correct. Nobody can find ONE premature death caused by HAP, and nobody can prove that a switch to LPG from TSF conferred a single DALY. That is the deceit of the Gold Standard Foundation and Sumi Mehta at GACC.
Did you have a chance to look at the WHO document I gave a link to a couple of days ago on HAP estimates. WHO has a spreadsheet on HAP attributable deaths by country and sex for under-5 and 25+ age groups for 2012. The numbers are given as ranges, which may give an impression that these reflect uncertainty in the otherwise legitimate estimates. That would be an incorrect impression. There is no there there, as the WHO document would itself confirm!
Where are the bodies dead? Or where are the lives saved from “truly health protective” ISO Tier 4 stoves like gas and electricity?
Conundrums, conundrums. Life is full of manufactured surprises. Not everybody in public health field takes IHME – Chris Murray, Alan Lopez – and the “pioneers” of PM2.5 theology such as C. Arden Pope (there are some other key figures) seriously.
But that is off-topic. To me, the constituents of PM2.5 are hugely important, beginning with SO2 and PAHs. EPA chose equitoxicity assumption so it can cook up justification for every new rule after it no longer had “acid rain” monster to market.”
Of course lifespan goes up as wealth goes up. (At least it has until the current obesity problem.) It goes up more than the small average reduction in lifespan due to pollution, though some people (like me) may be more adversely affected than the average person.
Wealth is healthy. Poverty is unhealthy.