
The Energy Collective Group
This group brings together the best thinkers on energy and climate. Join us for smart, insightful posts and conversations about where the energy industry is and where it is going.
Post
Renewable Generation Capacity Expected to Account for Most 2016 Capacity Additions

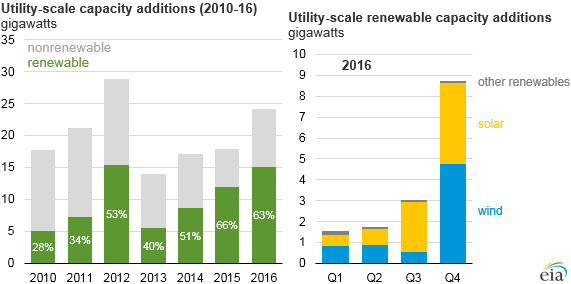
Source: U.S. Energy Information Administration, Electric Generators Report. Note: The last two months of 2016 are based on planned reported additions and are subject to change.
Once final data are in, EIA expects 24 gigawatts (GW) of new generating capacity to be added to the power grid during 2016. For the third consecutive year, more than half of these additions are renewable technologies, especially wind and solar.
Of the 2016 renewable additions, nearly 60% were scheduled to come online during the fourth quarter. Renewable capacity additions are often highest in the final months of the year, in part, because of timing qualifications for federal, state, or local tax incentives. Estimated fourth-quarter capacity additions for 2016 are based on planned additions reported to EIA and are subject to change based on actual project schedules.
Monthly U.S. renewable electricity generation peaked in March as high precipitation and melting snowpack led to a monthly peak in hydroelectric generation and strong wind resources led to a monthly peak in wind generation. Most renewable generation comes from the Western census division, which accounted for the majority of the hydroelectric (63%) and solar (77%) generation in the United States in 2016. Wind generation was more evenly spread across the country with 37% occurring in the Midwest, 35% in the South, 24% in the West, and the remaining 4% in the Northeast.
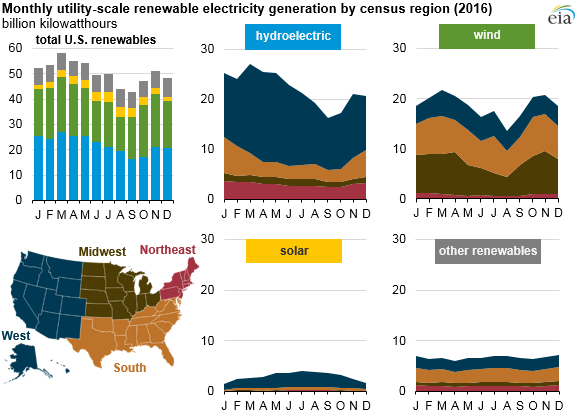
Source: U.S. Energy Information Administration, Monthly Energy Review and Short-Term Energy Outlook. Note: The last two months of 2016 are projections and are subject to change.
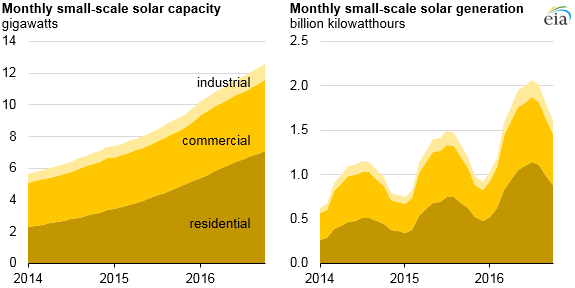
At the end of 2015, EIA began publishing monthly estimates for distributed small-scale solar photovoltaic (PV) (one megawatt or less) capacity and generation. As of October 2016, the United States had a total of 12.6 GW of small-scale solar PV installed. Of this capacity, 56% was in the residential sector, 36% in the commercial sector, and 8% in the industrial sector. Monthly generation from small-scale solar PV peaked in July at 2.1 billion kilowatthours (kWh).
The distinction between capacity and generation shares is important to recognize. Because non-dispatchable technologies such as wind and solar facilities generate power only to the extent those respective resources are available, their capacity factors are typically lower than those of other resources.
Source: U.S. Energy Information Administration, Monthly Electric Utility Sales and Revenue
- The production tax credit (PTC) for wind and the solar investment tax credit (ITC) were extended at the end of 2015. The tax credits include an eventual decline in value for both technologies with the PTC for wind expiring in 2020 and the ITC for large-scale solar declining from 30% to a permanent 10% and expiring for residential projects in 2022.
- New York, Oregon, and the District of Columbia extended and expanded their mandates for renewable electric generation to reach 50% of each state’s total electricity generation by 2030, 2032, and 2040, respectively.
- Hydroelectric generation increased as drought conditions that affected hydroelectric generation on the West Coast in 2014 and 2015 diminished.
Principal contributor: Cara Marcy
Discussions
No discussions yet. Start a discussion below.
- Costs of Different Battery Storage Technologies Depend on Technical Characteristics
- Electric Power Sector Consumption of Fossil Fuels at Lowest Level Since 1994
- Electrified Vehicles Continue to See Slow Growth and Less Use than Conventional Vehicles
- The United States is a Net Energy Importer from Canada
Get Published - Build a Following
The Energy Central Power Industry Network® is based on one core idea - power industry professionals helping each other and advancing the industry by sharing and learning from each other.
If you have an experience or insight to share or have learned something from a conference or seminar, your peers and colleagues on Energy Central want to hear about it. It's also easy to share a link to an article you've liked or an industry resource that you think would be helpful.


Sign in to Participate