From the way media and climate scientists portray the global air temperature this past year, you’d think there was only one place to go – up. For example, Gavin is holding on to hope:
With update thru September, ~80% chance of 2017 being 2nd warmest yr in the GISTEMP analysis (~20% for 3rd warmest). pic.twitter.com/k3CEM9rGHY
— Gavin Schmidt (@ClimateOfGavin) October 17, 2017
Next year will be interesting.
However, oceans rule the temperature of the planet, and as this most recent SST shows, there’s a lot of cool water and a clear signature of La Niña shaping up off the coast of South America:

Source: http://www.ospo.noaa.gov/Products/ocean/sst/anomaly/
Ron Clutz of Science Matters writes:
September Sea Surface Temperatures (SSTs) are now available, and we see downward spikes in ocean temps everywhere, led by sharp decreases in the Tropics and SH, reversing the bump upward last month. The Tropical cooling in particular factors into forecasters favoring an unusually late La Nina appearance in coming months.
HadSST is generally regarded as the best of the global SST data sets, and so the temperature story here comes from that source, the latest version being HadSST3.
The chart below shows SST monthly anomalies as reported in HadSST3 starting in 2015 through September 2017.
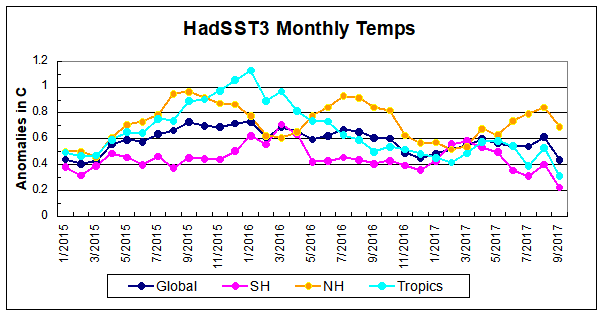
The August bump upward was overcome with the Global average matching the lowest level in the chart at February 2015. September NH temps almost erased a three-month climb; even so 9/2017 is well below the previous two years. Meanwhile SH and the Tropics are setting new lows for this period. With current reports from the El Nino 3.4 grid sector, it seems likely October will go even lower, with downward moves across all oceans.
Note that higher temps in 2015 and 2016 were first of all due to a sharp rise in Tropical SST, beginning in March 2015, peaking in January 2016, and steadily declining back to its beginning level. Secondly, the Northern Hemisphere added two bumps on the shoulders of Tropical warming, with peaks in August of each year. Also, note that the global release of heat was not dramatic, due to the Southern Hemisphere offsetting the Northern one. […]
Summary
We have seen lots of claims about the temperature records for 2016 and 2015 proving dangerous man made warming. At least one senator stated that in a confirmation hearing. Yet HadSST3 data for the last two years show how obvious is the ocean’s governing of global average temperatures.
Good to see the 1930s have finally been put in their place! Cheekly blighters with all that “false” warming they used to show…
Forgot your /sarc tag! I agree: on what planet we’re the early 40’s warmer than the mid 30’s? Surely not Earth…
we’re?
CLIMATE CHANGE/WARMING is just another tax scam fabricated by usual suspects, government, i.e. politicians. The original tax scam in USA is the income tax. Too bad citizens never bother to read their own laws and regs.
“Exempt income” and “Income that is not” … are ALREADY legally defined, codified in U.S. tax regulations.
Look it up…
“exempt income means”
“income that is not considered tax exempt”
ecfr g ov
Any ocean cooling currently being experienced is due to vast melt off at the poles which is also due in part to solar/earth dynamics and the fact that earth’s orbit has changed enough since 2004 to expose far greater swaths of the planet to high incidence angle sunlight. Volcanic activity, especially oceanic, has markedly increased due to the increase in crustal stress from orbital changes. What is occurring in the Antarctic alone is truly remarkable. The moon, ever the handy dynamic lever that it is, now moves through dozens of degrees of latitude per MONTH rather than the former total of 10deg per YEAR. Many quakes are easily predictable by simply observing the moon’s orbital changes.
Also, they don’t aerosolize the atmosphere the world over just for giggles. It is largely to mitigate increased solar radiation. The sun now rises and sets over canada in summer, far north of 23.5deg north at the tropic of cancer that runs through central mexico.
See divulgence dot net
net search – “Huge Media Blackout Regarding ‘Supermoons’, Orbital and Axis Changes, Quakes and Tsunami”
Also related, see – “Ancient High Performance Electric Motors Discovered….That Are Still In Production!”
Good Journeys
Fisheries on Mars, flying craft and contrails on Mars? Rockets, cities, ice oceans. Your blog is bizarre. You can’t just have an opinion and declare it as a fact. You need empirical evidence, collected over time and cogent analysis of that data. Your blog is none of those. Pure irrational supposition.
divulgence dot net is a waste of time. An entertaining one, for a glimpse of confabulation-in-process, certainly. But still, a waste of time.
>vast melt-off at the poles
WTF? Greenland gained ice in the last ice-year. Meanwhile Arctic sea ice has been steady for about five years. And, that other pole, Antarctica, different methods show different things. consensus graph, last five years of sea ice
Once more, in English this time.
Giant bugs, giant snails, and earthworms a mile long on Mars?
https://marsimages.wordpress.com/
I’m having trouble taking techstufblog seriously.
Too long
“The moon, ever the handy dynamic lever that it is, now moves through dozens of degrees of latitude per MONTH rather than the former total of 10deg per YEAR. ”
_________________________
Are you suggesting the Moon fell out of its orbit?
Better put anouthef layer on that tin foil hat,their out to get us…..
Yup. All that melting and run off:
http://www.dmi.dk/en/groenland/maalinger/greenland-ice-sheet-surface-mass-budget/
http://www.cnn.com/2015/11/03/world/antarctica-ice-gain/index.html
Weirdly, actual real-world measurements disagree.
any changes in overall salinity with the melt off
Can I have some of what you’re smoking please?
On the other hand, no thanks.
“is due to vast melt off at the poles ”
ROFLMAO
Antarctic is about at its norm for this time of year
Arctic is currently on its freeze-up heading into winter.
TRY AGAIN, with some actual pre-thought this time !!
And Green land has had one of its largest positive Surface Mass Balances in quite a while.
AndyG55 says: “Arctic is currently on its freeze-up”
..
Which is true.
…
AndyG55 fails to mention that the Arctic is below 2 standard deviations the average for this time.
….
http://nsidc.org/data/seaice_index/images/daily_images/N_stddev_timeseries.png
…
AndyG55 must not understand what 2 standard deviations means.
PS AndyG55, Greenland Surface Mass Balance (SMB) is the output of a MODEL
PPS, WordPress must be caching the image(s) of Arctic sea ice extent. The link I posted was current to Oct27th, but WordPress shows you Oct 4th.
I want a job where you can make at least $1000 a day and you don’t have to get out of bed. And someone else could make the phone calls for me.
Apparently for Mr Johnson, history began in 1981.
https://www.canadiangeographic.ca/article/northwest-passage-trailblazer
In 1940, ice conditions were comparable to today. That boat had a wood hull then, they use reinforced steel now. I hardly see this year’s NH ice figures as a spiral downward.
By the way sir, you just invalidated any future statements you make which are validated by “the output of a MODEL”.
techstufblog: It’s a long time since I’ve seen so much guff in one comment. Was this written by a marauding netbot?
Rich.
Astronomer here. The moons orbit in not aligned with the ecliptic. It is offset by about 20 degrees I think. Lines of latitude run east /west. The moon would naturally move through several lines of latitude per day, if you were measuring it against the Earth. This is because the moon is in motion, in an orbit that is 20 degrees off. There may be some relevance that the moon’s gravity is strong enough to help drive, or at least, partially direct plate tectonics. It certainly did in the past, so it is possible that weaker areas of the Earths crust would be sensitive to it. The oceans are cooling because solar activity has weakened. As far as the tropics. The Earth is not locked in its current tilt direction. As the seasons change, different areas of the Earth receive different amounts of sunlight. Looking at a time-lapse series of photos of Earth taken from orbit reveals this. In the winter, for example, the Whichever hemisphere that is in winter has a shaded pole. That shade is due to the Sun not rising. The light/shade mark is the day/night division. In the summer, that same pole will be fully illuminated. But as far as the tropics are concerned, there is this thing called the “Precession of the Equinox.” This is caused by the physical wobble of the Earth. The effects as observed from the ground would cause Constellations to rise and set when measured against fixed points in time, such as the solstices and equinoxes. A “Supermoon” is a “click-bait” type of talking point. The Earth is almost 5 Billion years old. How many “Supermoons” has it survived? Ancient motors? Cant be ruled out, you could have had a more advanced form of humanity that died out from this or that co-existing along side a more primitive people. As my ultimate example of this, I give you either the untouched tribes of South America or the Aborigines of Australia. Imagine, if you will, 100,000 years from now, a race of people that have very little knowledge of where they came from. Mostly legends with no real documentation. Through trial and error they make many of the same discoveries as their forgotten ancestors. One day, an archaeologist discovers the Smithsonian itself, perfectly preserved, with all its wonders. Clearly labeled, easy to date, they can tell that unquestionably, these artifacts are 1 million years old. Now, that same team, two years later discovers an ancient village on the other side of the world where a stone spear dates to the EXACT SAME TIME as the rockets and wonders discovered at the other sight. What conclusions would be drawn from such discoveries? Was one set the Gods to another? Did aliens give one set advanced tech while letting the others suffer? Was one side the slaves to the other? IOWs, it would not make much sense to have these two peoples from the same time and yet so different, and yet, there it is. Right here, right now. And if it happened now, it could have happened then. Go back in time far enough and ALL objects on the surface are scrubbed and recycled through plate tectonics. Go into the future far enough and the exact same things happened. This is science. Not myth or “ancient book” or “Rock with scribble”, no. This is predictable, presentable, and repeatable.
For Troll Johnson, history began whenever his handlers tell him it started.
Troll Johnson, all models are wrong, some are useful.
Just because one group of models has proven to be useless is not evidence that all models are useless.
Your only skill is embarrassing yourself.
When the moon is in the Seventh House
And Jupiter aligns with Mars
Then peace will guide the planets
And love will steer the stars
This is the dawning of the age of Aquarius
Age of Aquarius
Aquarius
Aquarius
Did you hope to counter reality with your gibberish? It failed. Buy a parka.
Little Johnson,
Current Arctic sea ice levels are above what they have been for some 90-95% of the last 10,000 years.
They have dropped down from the EXTREME highs pf the LIA, The late 1970’s was up there with those LIA EXTREME highs.
Again you show you have zero cognizance and are just plain ignorant of reality.
Greenland is also very near its highest level in 8000 + years.
You were probably ignorant of that , as well.
That seems to be all you little rants are based on. lack of knowing anything..

And to try to help little johnson overcome his obvious ignorance and get some general perspective into his troll/worm-like existence, here is a graph of the “Greenland Total Ice Mass since 1900”.

Didn’t anyone notice the graph Mark S Johnson put up was for 2015-2016 and not the current graph for Arctic sea ice? And that the point below 2 std dev is from end of March 2016?
Would it make a point about current sea ice extent for me to put up a graph from 1977?
Or? You could just look at the current satellite composite image from NSIDC which shows Arctic Sea covered with tropical beaches and palm trees. Wait, what? Ice coverage is not disappearing, that is all you really need to know.
Sun cycles 24-27 will be colder
The current solar cycle is 24. Do you mean 25-27?
Actually, if you look at the data the trends are very stable. This makes sense, considering a volcano produces more atmospheric pollutants than all the human industrial production ever. But of course that’s inconvenient for a political class that banks their power on everyone else’s fear of the intangible.
The Dalton minimum coincided with a massive volcano eruption and the New Madrid earthquake. If we see that kind of activity during the present solar minimum, it might suggest a correlation between anomalously low solar activity and elevated tectonic activity.
Volcanic eruptions do seem to coincide with solar minimum so we can expect more in the next few decades. As for tectonic shifts which are earthquakes, they are driven by increases in the solar wind and occur where the stream hit the atmosphere. The why is a bit more difficult but try looking at the solar wind any time there is an earthquake in the news and certain you will see it at the top of the speed range.
I think I just saw the same guy saying the same thing, and not bothering to elaborate.
love the way 1880 starts at zero…..must have been perfect then
Exactly, if we did have actual temperature data from say 14000 years ago when Ohio was under 5000 feet of ice, we would see a steady upward increase in temperatures as the ice age receded. The Earth has been warming for 14000 years with some small periods of cooling and it may continue warming until all the ice caps are melted as they were in the past? Man’s contribution is minuscule compared to the power of the universe.
Climate change… the way you know it is a political tool to tax USA and pay the largest CO2 emitter – China, are the facts are not following the scientific method. They only talk about the supply of CO2, never the demand. They only talk about the affects of raising temps, never the agricultural affects of more CO2 (Hint, it is plant food).. But most important fact missing from these “scientists” – The Earth can only sustain 2 billion people without burning fossil fuel.. John Deere does not run on batteries. So, what to do with the 5 or 6 billion corps ?
From 12/15/2016: https://electrek.co/2016/12/05/john-deere-electric-tractor-prototype/
Their workin onit. Next up: Nuclear!
Pilot Dave & Yirgach – That green and yellow thing isn’t a tractor worthy of pulling a plow. These are real tractors:
https://youtu.be/vLNQyJqcE5I
They will be plowing long after that green and yellow thing is buried in a toxic waste landfill.
Yirgach:
“Zero emission agriculture”! Whence does the electric tractor charge its batteries? Unless the power source is nuclear, hydro, wind or solar, there will be emissions. And even with those, more CO2 and/or environmental degradation.
Fewer birds and bats to eat insect pests, so more need for fossil-fuel-based pesticides.
Neil,
Now that is maximal emission agriculture. But I shudder at how much those monsters must compact the soil they plough.
My god, it takes too long to refuel a combine now. We only have a short window to cover all our acreage, planting or harvesting. Can you imagine the battery capacity and charge time required to replace a 325 HP (242.4 kilowatt) diesel?
“The Earth can only sustain 2 billion people without burning fossil fuel”
This is not sustainable! Fossil fuel is the accumulation of the sun’s energy by plants and warehoused as hydrocarbons for millions of years. Fossil fuel is being burned faster than it is being replenished. Fossil fuel will one day run out.
Fossil fuels are a good way for the human society to bootstrap itself into the next method of power generation and use. God gave humans fossils fuels so that we could build first generation solar panels (you can’t build solar panels using the power from solar panels that have not yet been produced) and deserts to put them into so that we could generate renewable power to run society and built the next generation of solar panels.
If the earth can only (renewably) sustain 2 billion people… we had better start colonizing new real estate (mars is a good start).
“The Earth can only sustain 2 billion people without burning fossil fuel.. ”
Where does that ‘fact’ come from? BTW, where does the hydrocarbons on Titan come from? Fossil fuels? Did the dinos fly to Titan? Or maybe, just maybe there is a abiotic source for hydrocarbons too?
Do we know all hydrocarbon resources on Earth?
What about all those new CH4 vents recently found in the ocean? Or about the methane clathrates at the ocean bottom?
“Saturn’s orange moon Titan has hundreds of times more liquid hydrocarbons than all the known oil and natural gas reserves on Earth, according to new data from NASA’s Cassini spacecraft”
https://www.nasa.gov/mission_pages/cassini/media/cassini-20080213.html
Just off the top off my head, diesel/electric makes sense for a tractor. They don’t need to go fast but have need for lots of low end torque.
There may be drawbacks such as extra complexity or weight.
Spot on!!!
funny how the same places will have a positive anomaly for 40 years…..
…that’s not an anomaly!!
40 years is an anomaly. The little ice age was an anomaly.
[??? .mod]
Or they represent cycles of roughly that duration of time. Which then cycle in the other direction, as has been demonstrated in countless climate reconstructions, some going back eons.
Well crap. Anything is an anomaly compared to a “norm” of a different value. The trouble is that “norms” are subjective sorts of things.
“The little ice age was an anomaly.”
Yep , and can’t we all be VERY THANKFUL that we have has some SLIGHT warming out of that COLDEST of times.
Krakatoa- 1883….
Krakatoa erupts – Aug 27, 1883 – HISTORY.com
http://www.history.com/this-day-in-history/krakatoa-erupts
God I miss 1880 (sigh).
Inconvenient: oceans continue to cool
No problem:
Correcting Ocean Cooling
Possibly the most glaring example of widespread and group confirmation bias in modern science.
They took direct sea temperature measurements with XBT probes and later, ARGO buoys. They did not like what the direct measures told them, so they corrected them using indirect measurements from ERBE and CERES flux measurements, satellite sea level measurements, GRACE gravity measurements, and inferences. All, in their minds, much better than direct measurements with some of the most advanced instrumentation available.
For those of you who have not seen the article, follow the link and give it a once-over. It is on the NASA website.
@Steve Case and @TonyL
Can’t agree more Tony. When they found the result (Ocean cooling) didn’t match their religion or hypothesis of Ocean warming they spent all their efforts trying to prove why the results were wrong! I’ve never read so much scientific bull, ever! Just sums up global warming ‘research’. They must follow an alarmist methodology; the ‘scientific’ method they follow being – whatever the data shows how can they make any inconvenient results prove their global warming alarmist prophecy.
@ Hot:
Indeed!
A first read shows how they sought out other data sets for confirmation of their results. Fair enough, so far so good. It all sounds reasonable and plausible. Then down near the bottom of the article we find this:
They took as a foundational principle that Sea Level Rise is accelerating. Then they were unrelenting in bashing the data until it conformed with that need.
The trouble is that SLR is *not* accelerating.
I took a look at the Boston Tide Gauge data recently. There is absolutely 0.00% acceleration in the data. I *was* able to see the moon’s orbital inclination cycle (18.60 years) in the data.
If you ignore all the previous data and just look at 1993 on, it looks like acceleration but is really just the long term orbital cycles at play.
If you do not understand the effects of the moon on sea level, you probably should not be messing around with sea level data.
East Anglia was not an outlier but rather exposed the lengths to which these flimflam artists will go. They will never acknowledge stagnant or declining temperatures until they decline by whole numbers over many years. They will claim warming where none exists and they will program their models to make it so. And when people declare that seasonally winters are getting colder and snowier in their home towns, they will be called idiots for not realizing that weather cannot be conflated with climate unless it destroys property and takes life in which case it is man made.
We will need a mini-ice age for these charlatans, with government funded agendas, to scurry off into hiding places and desist with this global ending global warming nonsense. They will disappear without so much as a “never mind!”
However they will lay low for a few years and then they will dust off all the academic papers from the 70’s and declare shamelessly that the coming Ice age is all because of man burning fossil fuel and they have determined sans polling that they have a 97% consensus which has been thoroughly peer reviewed and anyone who disagrees with them is a science denier and call for a Government inquisition. Second verse same as the first.
This is not representative of the scientific method at all. In the scientific method, you:
A. Make an observation
B. Form a question
C. Form a hypothesis
D. Conduct an experiment
E. Analyze the data, and …
F. Draw a conclusion
These are the simple steps provided for children to understand how science is SUPPOSED to work.
What we clearly see from Willis is that warming is the foregone conclusion, to linearly match the increase in atmospheric CO2, and a breakdown of the integrity of science and the scientific method.
http://www.schoolofdragons.com/how-to-train-your-dragon/the-scientific-method/scientific-method-steps
Guess you don’t understand or appreciate the IMPORTANCE of presenting all information in manner that supports the Progressive Agenda du Jour!??? Well shame on you for trying to be objective – TOTALLY uncalled for!
Thanks Steve for the link & reminder. I value that article as a classic masterpiece, really worth a read.
Steve
Interesting paper in that it contains admissions of errors and looks for ways to correct them. I get the impression that ‘correcting the XRT data’ was not entirely without bias, meaning that it seems awfully convenient to have the data corrected and it finally matches (sort of) the models they admit were not able to reproduce the ups and downs observed by every set of measurements. It really does sound as if they corrected the data until it matched the expectations of the models and independent approaches.
I am not saying definitively that is what happens, I think the details are not in the paper to support that opinion categorically. It seems to conclude that the warming from 1993 was less than thought because the warming 1980-1993 was more than thought. Is that correct?
Many papers and opinions have passed under the bridge of ‘acceleration’ in sea level rise and ocean heat content. Time and again, it just isn’t there. Why is anyone surprised? The expected temperature rise isn’t there either. Neither is the hotspot. In the search for something alarming, many stoves have been turned over yet the little bugger remains elusive.
It is just not that exciting or alarming or anything we have to worry about compared with economic injustice, international lawlessness and the fundamentally cybercrime-nature of the banking systems. Global *yawn* warming….yeah, right.
And yet Public Agencies are left to drift about in a warmist sea and develop “Adaptation Strategies” with a CO2 mitigation component. This due to an over reliance on faulty modelling projections.
See http://www.trpc.org/580/Thurston-Climate-Adaptation-Plan
for a rather politically distorted view on a simple issue.
If I were to adjust the parameters of interpolation gridding to produce anomaly maps that create the unrealistic blotchy patterns that climatastrologists seem to prefer, my boss wouldn’t take me or my results too serious.
Two choices: Recover the Argo floats and check their calibration to determine if they are reading correctly or use imprecise data from other indirect sources and torture it until it matches the models. Obviously, the first choice is wrong as it will give the wrong answers. Welcome to climate “science”.
then, we must heat the oceans.
I work with people like these.
Your link is not comforting. Gov’t scientists. Ha!
“With update thru September, ~80% chance of 2017 being 2nd warmest yr in the GISTEMP analysis”
And how much of those data are simply made up rather than actually measured? Most, correct?
mini ice age coming soon to a neighborhood near you.
That’s no doubt part of it, but satellite data has also seen a fair number of warm months. My view is this is due to the absence of a real La Nina (driven by Bjerknes feedback) following the 2014-2016 El Nino. There was lots of warm water left over that was not pushed back into the Pacific Warm Pool. It is that warmer ocean water that has driven the warm 2017 temperatures.
I mentioned early this year that it looked like we might get a La Nina even as all the models were predicting El Nino. It just took a long time wind/ocean current positive feedback to take hold.
Of course, this means a lot of warm water was cooled during this period. As mentioned often here, this is truly a cooling of the planet as the warmth temporarily passes through the atmosphere on its way to space.
So planetary orbit is going to come into play. Saturn has a 535 year orbit and Jupiter has a 11.5 year orbit. In 2021 they will both be opposite the earth during the winter. I imagine the tides caused by the planets on the sun will prove to have a profound effect on our winters. I expect colder winters for the next decade with 2021 being rather cold.
Their gravitational influence will have effectively zero effect.
No, Saturn and Jupiter are massive enough to affect Earth’s orbit and rotation. I would assume this effect applies especially to when they are aligned. The Earth is not rotating around the sun, everything including the sun is rotating around the gravitational center (barycenter) of the solar system, which the gas giants (especially Jupiter) help to create, and this point is constantly changing relative to the motions of these bodies.
https://www.sciencedaily.com/releases/1997/12/971218090305.htm
https://weathercycles.wordpress.com/2016/01/08/earths-climate-linked-to-jupiter-saturn-and-the-solar-system-barycentre-discussion-open/
Jupiter’s gravity influences the Earth’s rotation?
What exactly have you been smoking?
I haven’t been smoking anything MarkW, I’ve been reading, apparently something that many here could benefit from.
http://www.pattern-recogn-phys.net/1/107/2013/prp-1-107-2013.pdf
Found this cool site that shows the sun’s displacement via planetary gravity. Picking both jupiter and saturn gives an interesting loop to the sun with approx. a 1.5 diameter displacement.
http://astro.unl.edu/classaction/animations/extrasolarplanets/ca_extrasolarplanets_starwobble.html
Saturn has as 29.5 year orbit.
Ya, my goof. Every 595 years of so because of the variation in the orbit of Saturn and Jupiter, they end up on the opposite side of the sun for our winter.
Saturn has an orbital period of about 30 years, not 535 years.
The planets have far less effect on the tides than the Moon. That was proven in the last “celestial lineup”.
Just a correction: Saturn’s orbital period is 29.457 years, and Jupiter’s is 11.86 years.
“Saturn has a 535 year orbit”
Saturn has a 29 1/2 year orbit.
Saturn has a 29 1/2 year orbit. There is symmetry if they perturb Earth’s orbit to the point of colder winters, then hotter summers would occur too. More likely an effect will be the solar minimum approaching the Marauder Minimum.
“approaching the Marauder Minimum”
Does this mean there will be less marauders? or there will be smaller marauders?
That could turn us all into berserkers..
or as the AGW crowd say.. there must be a bucineer !!
When the temperature dropped, the Norse tended to go a-Viking.
The cycle may be broken, though – decades of the Nanny State has turned them into patsies that can’t even defend their own territory.
(Note, though, that Minnesotans are not quite so wussified – that could be a problem…)
Excuse me, Donald Hudson, but Saturn has a 29.457 Earth years orbital period, NOT 535 years. I do not know where you got the number 535, but it is incorrect. Even Pluto’s orbit is NOT 535 Earth years.
Never mind. I see everyone else caught that 535 number, too. I will regard it as a typo and let it go.
Don Hanson:
A we all know, a gravitational force diminishes as the distance squared…the inverse square law. A tidal force is a differential gravitational force, so it diminishes as the distance cubed. That’s why earth’s tides are primarily caused by the moon, and only secondarily on the much more massive sun, because the moon is so much closer to earth than the sun. As for the major planets Jupiter and Saturn, Jupiter is about 5 times farther from earth than the sun, and less than 1% the sun’s mass, so Jupiter’s tidal effect on earth is less than 0.01% that of the sun. Saturn is twice as far from earth as Jupiter, and about a third the mass, so it’s tidal effect on earth is less than 5% that of Jupiter.
But your statement is about Tidal effects on the sun, caused by the planets, which you imagine (your word) can cause a profound effect on our winters (Northern or Southern hemisphere or both?)?
Also, take a look at what is happening in Antarctica atm. The ice extent is increasing, which is very unusual for this time of year.
http://nsidc.org/arcticseaicenews/
not that unusual at all: the El nino warm waters are leaving the antarctic… next year the antarctic will be again “normal” to above avarage if it’s trend continues….
Yes, and Antarctica had one of the latest maximums on record – a “double bump” with an early ‘faux max’ that got all the doomsters excited. However, I have heard only ‘crickets’ on the second (higher) maximum, and the current slowdown in extent loss. Something is definitely going on down there, and few seem to be talking about it.
Imo, that is likely due to the change in surface wind patterns around the continent. For the last several years there were strong southern surface wind intrusions which pushed into the edge of the continent, bringing warm surface winds which also carried more moisture into areas. That steady stream of south flowing wind flows stopped around June of this year as a circular buffering wind pattern asserted itself which lead to increased protection of the ice shelves from warm surface wind flows. I have saved several years of daily screenshots of temperature changes in Antarctica. The surface wind effects clearly show up as they are an important factor in temp changes across Antarctica and the surrounding sea ice extent.
goldminor
Please show your proof, your examples.
From 1992 through 2015, the Antarctic sea ice steadily increased. At its satellite-era record high in June 2014, the ANtarctic sea ice area was 2.14 Mkm^2 LARGER than average, an anomaly larger than the entire land area of Greenland’s 2.06 Mkm^2.
Shortly therefter, the Univ of Illinois Cryosphere sensor crashed, and they have been out of service since then. The Cryosphere principles have separated/retired/been fired, and the ANtarctic sea ice extents suddenly dropped about 1.3 Mkm^2 to a 2016 low averaging 1.5 Mkm^2 BELOW average ANtarcic sea ice extents.
Since mid-summer 2017, ANtarctic sea ice extents have recovered another 1.0 Mkm^2 (1/2 Greenland increase in area), and are ow approaching their long-term average extents.
May yet increase past normal the next few weeks, as they apparently continue to expand despite the “reset” when the Cryosphere lab died/changed/came under new management.
Now, nowhere in these recent three years have the winds changed consistent with the area changes. For your theory to hold, you must explain each deviation from the long-term growth (1992-2015), the 2015-2016 decrease – NOT consistent with the El Nino north of the Antarctic by tens of thousands of kilometers – unless you’re willing to show how currents flow backwards, and the 2017 recovery towards normal.
I could be convinced, but not yet.
I drew my inferences from watching and saving daily screenshots of Antarctic temps using earth null school. Looking at temps allowed me to come to understand in part how incoming flows of warmer, lower latitude surface air flowing south into Antarctica would influence sea ice extent and temps on the continent.
I noticed how the warmer, southern flowing surface wind flows coincided with the daily sea ice extent changes around the continent. I could further explain with pictures, but my XP computer died several months back, motherboard most likely. All of my years of saved material is on the drive though. So I will have to eventually buy a cheap used XP based computer.
I remember the unisys sst chart was reset a few years ago because there were “instrument problems”. The reset changed the predominant cooler blue color to the warmer yellow orange. Now the sst charts are become more predominantly blue again
Love those cooling waters Makes surf fishing great
+1
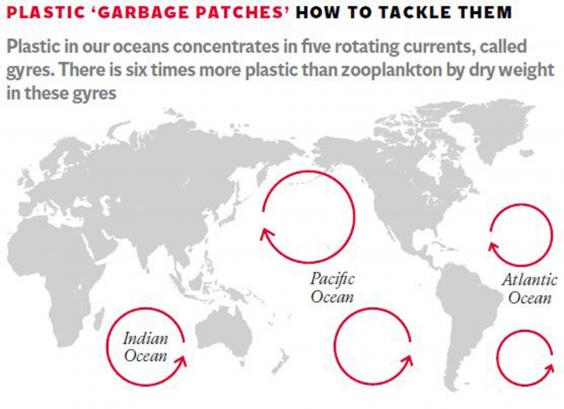
I saw a video of the enormous floating plastic garbage “island” in the oceans. Maybe we should abandon this human caused global warming nonsense and focus all those resources, time and money at cleaning up that trash in the oceans.
Good idea. We also need to use more bio-degradable plastics.
It seems the ocean gyres are garbage collectors.
Greenies like to recycle.
Why aren’t they out there scooping up all this plastic and changing into chairs or something ?
Soros and Al Gore could fund such a worthwhile environmental venture.. couldn’t they ? 😉
The bio-degradable plastics break down into “harmless” nano-particles. But now we are finding them being eaten by fish. Still no proof they are digested, or impact the fish. But they are part of the food chain now.
I noticed the salmon I eat are now more chewy. /sarc
Plastic is bio-degradable. Even more so when exposed to sunlight.
A bit of simple chemistry on three common plastics: Polyethene – (C2H4)n; Polypropylene – (C3H6)n; Polystyrene – (C8H8). And Cellulose (wood fiber) – (C6H10O5)n. Even if the said plastic garbage island exists (which it doesn’t) what is the problem?
There is one in the Caribbean. Off of Honduras. Fairly large, actually.
Ther are parts of the Sargasso sea just north Of Navidad bak and there are EPS (expanded Styrian Balls ) Styrophone broken down to the little white plastic balls
As far as the Eye can see if this is not a Plastic island I don Know what is.
it also supports a very large Ecosystem.
one of the tuna boats caught 28,000 Bluefin under a rotten paddle in the Pacific some years ago
Barnacles and other crusty stuff grows on the plastic and eventually it gets too heavy to float. While it does float it supports a micro-habitat. Far from shore most of the deep sea has little life, but where there are floating objects (such as a fouled boat-boittom) there are little swarms of fishes.
we do http://www.fishingforlitter.org.uk/ a friend of mine takes part in this scheme.
This “garbage island” consists of something like one small chunk of plastic for every square mile.
Yes
“Thanks for the truth” Very refreshing! We are in a Grand Solar Minimum, and things are going to get cooler, just wish the MSM would tell the truth, but thats just to inconvenient.
the problem I see is that it can become too cool, perhaps. If too cool we must go to sunbath on some rather tropical islands.
To gleefully misquote James Carville, “Its the Sun, stupid!”. Ya know? That big, flaming ball in the sky that has been rather quiescent during the last few years?
Wow, that was fast. This article is linked on Drudge Report… Cool.
NO, not cool. That was caused by global warming…
Well, thing have been heating up for the Watermelons, lately. 🙂
La Niña develops.
The heat is just going to its safe zone.
What do you expect when climate haters are allowed to speak!
That ‘cold blob’ that started a couple of years ago in the Pacific NW is now on the Alaskan/Canadian coast. Looks like another one developing in same region of NW Pacific now. May be a loong time for cold eastern Pacific coastal waters along North America if the flow mimics the earlier ‘warm blob’.
A sign of a return to a negative PDO?
Not sure what, if anything, it’s a sign of. Just an observation over several years. The ‘warm blob’ began in the same area and moved in the same direction.
Climate “scientists”. LOL!
Climastrologists performing climate séance.
Anthony, I was remarking on low volume of warm water in the equatorial Pacific despite temperatures being warm prior to the development of the El Nino on some of the last threads here by Bob Tisdale when the El Nino was having a long doubtful zig zag development. I was surprised (and suspicious) of the peak it reached, but not surprised when it just dropped like a rock.
I noted also, the stubborn hot blobs in the temperate/north Pacific suddenly turned to cold Blobs and rather than simple upwelling in the eastern equatorial, the growing cold Blobs in both the NH and SH were slanting down to the equator feeding the ENSO band.
Accordingly, I predicted a major cooling and have repeated this over the months here. It’s surprising to me that climate scientists haven’t picked up on this (Gavin still blaring about warming). I also predict it will become someone’s PhD thesis over the next year or so.
Doubtful that a sane PhD student would undertake a dissertation project that is orthogonal to the conventional wisdom, let alone find an advisor who would agree to this topic. See Judith Curry’s resignation letter and her comments at Climate Etc. for further edification.
that’s right. Not student with two fingers of front would dare to challenge “kosher” science with heretical paper.
i can remember those posts on bobs thread gary .looks like you were spot on regarding the lack of heat at depth .
Sea Surface Temperatures are entirely weather and solar driven, with help from nearly totally-not-understood forces behind ocean up-welling and down-welling currents. SSTs do not relate to ocean heat content (necessarily).
SSTs affect “Global Surface Temperature” because they are part of the formula.
Has anyone else noted that the Gav’s graph is struggling to maintain 1 degree above “the late 19th century”- while we have heard claims of much higher temperature rise claimed.
As if Gavin (or anybody else) knows what the global temperature was at the beginning of the twentieth century! I noticed he put error bars on his prediction for 2017. He should also put error bars on the temps before 1900 – any predictions on how wide those should be?
+/- 5 degrees C
One of the mysteries of climastrology is that often their reconstructions claim greater uncertainty for modern temperatures than for 100 year old temperatures.
Leftist agendas drive leftist governments and leftist models, but not Earth’s climate.
Leftist climate “models” are intentionally inaccurate because leftists:
(a) fudge climate warming/cooling cycles predating man-made emissions;
(b) fudge fluctuations in total solar irradiance (TSI);
(c) fudge temp data pre- and post-man-made emissions;
(d) fudge man-made and pre- and post-natural emissions;
(e) fudge absorption rates;
(f) fudge heat retention;
(g) fudge consequences . . .
Love to see some comparisons between Gavin’s farcical global temp graph and a bunch of rural, well sited temperature stations from around the world. That graph to me looks like pure fiction.
Go to https://realclimatescience.com/
Download the code and data base of USHCN stations that Tony Heller has provided and you can do your own plots and analysis to see how their claims match up for the United States.
As far as “global temperature” goes, there simply are not enough surface stations reporting for Gavin or anyone else to make the claims they know what the average surface temps of this planet is at any given time EVER! The fact that they claim to know using such limited data tells anyone honest and familiar with the situation all they need to know about the veracity of the claims of GISS.
https://realclimatescience.com/2017/10/the-wildly-fraudulent-noaa-climate-extremes-index/
100%
When some 200,000 standardized surface stations (about one for each thousand of Earth’s 196.94 million sq miles), placed at all elevations, have been reporting for 60 years, so that two 30-year units can be compared, then we might have a reasonably accurate and precise handle on global average surface temperature. No need for anomalies.
Your number is short by at least an order of magnitude. Probably several.
Forecast of the polar vortex in the lower stratosphere on November 1st. North America.
https://earth.nullschool.net/#2017/11/01/0000Z/wind/isobaric/70hPa/orthographic=-93.64,59.10,393
Cool! Ought to be nice and chilly by November 6th for the Scream At The Sky Because Trump Keeps Winning event.
Hope for sleet!
Plan for sleet if Gore participates! But then Gore is always barking at the moon and screaming. He should have a ‘bark collar’.
we are getting some southern vortex action here in scotland tomorrow wren, my first winter cod trip of the season ,perfect start weather wise.should be a nice northerly swell running by the time i start.
When ice caps melt, they dump cold water into the oceans.
Duh.
Warmist excuse.
Lame.
Which melting ice caps would those be?
The by far largest ice sheet, the East Antarctic, which contains most of the fresh water on earth, is gaining mass.
Not to mention that the vast majority of meltwater, almost 400 feet of sea level rise, occurred when the Earth was rapidly warming. So the mechanism the warmists are claiming is causing the cooling of sea surface temperatures only functions when it’s convenient, per climate séance.
That’s right, because everyone knows ice caps are floating on hot water and tropical land masses (where the temperature is SO much higher; maybe the ice just didn’t like the neighborhood!).
Indeed. Now…if only they oblige you and actually melt!
http://www.cnn.com/2015/11/03/world/antarctica-ice-gain/index.html
and
http://beta.dmi.dk/en/groenland/maalinger/greenland-ice-sheet-surface-mass-budget/
(duh?)
Follow the money! Those that argue and scream may have their federal grants up for renewal.
of course the sea is cooler, do you know how much ice has melted into it over the past decade? what do you think caused the ice age? It is coming to a wide consensus within the geological community that a large meteorite impacted the great north american ice cap causing sudden and catastrophic flooding, immediately cooling ocean temperatures and thus cooling the entire planet. But obviously it took a tremendous amount of heat to do so. Thats what we are looking at now, things are heating up, ice is melting, ocean temperatures are cooling, simple
So we had an ice cap, which means we were in an ice age. Then a meteor hit and caused an ice age. Then it warmed up which cooled the oceans.
I must have forgot to carry the one or something.
You didn’t throw your chicken bones correctly.
Bingo!
roflmao john 🙂
Ehh, no. The rate of melt water entering the oceans has been relatively constant for the past 8,000 years. The vast majority of melt water entered the oceans ca. 15,000-12,000 years ago when the atmosphere and oceans were rapidly warming. No one credible is claiming extraterrestrial debris has anything to do with the glacial/interglacial cycles.
“ice is melting, ocean temperatures are cooling, simple”
Ummmm.. NO.
Antarctic is currently skirting along its normal maximum
Arctic sea ice is GROWING as winter approaches, and is well above what it has been for some 90-95% of the last 10,000 years.
Greenland has just has it largest +ve SMB in a long time.
Its cooling ….. BECAUSE ITS COOLING !!!
Famous sayings uttered throughout human history:
Global Warming is real. The science is settled.
Phrenology is real. The science is settled.
Drapetomania is real. The science is settled.
Alchemy is real. The science is settled.
Phlogiston is real. The science is settled.
The Ptolemaic Model is real. The science is settled.
I still don’t believe that back in 1900 they had anywhere near the precise, accurate data they needed to determine the temperature of the oceans.
La Niña develops because surface water, which is warm, gets wind-blown shoved westward and then mixed in elsewhere as it rides the choppy surface and undercurrents. El Niño develops because winds change that allows the surface water, which is warm, to relax back across the surface and layer up with warm water on the top. So, heating up or cooling down can be just the allusionary outcome of different mixing conditions while total global ocean heat remains balanced. However, the ice cores tell us that there are long term severe swings. That said, there is no way to measure balance or imbalance, yet, in incremental total increase or decrease in ocean heat content. Plus, no one lives long enough, nor their stored data to know what slope they are on. The next ice age will remove all our stored data and we will eventually repeat the unknowing scare that the world is ending because it is too cold or too hot and we are to blame.
If there is one thing we can count on it is this: humans never learn. They still make ludicrous decisions based on their limited knowledge that only extends to the end of their noses. It is just that their implements change that support their notions.
Algore will say massive increase in hurricanes sucking heat out of the oceans
But he’ll charge for it and make it sound boring. And that, my friend, is the Al Gore magic!
“We have seen lots of claims about the temperature records for 2016 and 2015 proving dangerous man made warming. ”
Ah no. Nobody argues that the records PROVE.. DANGEROUS man made warming.
here is what we expect.
1. If we continue to dump c02, we expect temperature to generally increase,
not every year, not monotonically, but over LONG PERIODS we expect them
to go up.
2. How much? How much depends on several things.
a) the amount of c02 and methane and other ghgs we admit.
b) the amount and kind of land use changes we see
c) the frequency and severity of volcanoes
d) if we hold everything else equal, then we expect between 1.5 and 4.5C of warming
for a doubling of c02, OVER THE LONG TERM
3. Over the short term we do NOT expect every year to set a record,
we expect variability, some colder years, some warmer years, even streches
of no warming or slight cooling.
4. DANGEROUS warming is in the future, and here there is room for debate
how much danger? who will suffer most? who may even benefit. As the
IPCC explains there will be winners and losers.
If you draw a cartoon of the science ( as journalists and skeptics do) then its easy to be confused
4.5C???? That’s batsh*t crazy.
October 18, 2017 (LifeSiteNews) — Social scientist and author Steven Mosher called the global warming movement an enemy of the sanctity of innocent human life at an international symposium that began online Tuesday to address the anti-Christian nature of population control.
Mosher, long recognized as an expert in China’s domestic policy, started his address by explaining that the earth’s temperature has always fluctuated, sometimes dramatically.
“I did a historical study of climate change in China, which shows that the climate in China 2,000 years ago was several degrees warmer than it is today,” Mosher said, adding, “And of course that was a long time before we started hearing about climate change and global warming.”
Mosh seems to forget that during the ice ages…
When CO2 concentrations are high, the world cools into a glacial era.
When CO2 concentrations are low, the world warms into an interglacial.
How does that happen, Mosh, if Co2 can cause 4.5 deg c per doubling?
Admit it – the effects of CO2 have been highly exaggerated.
Ralph
Mosh seems to forget that the signature of increasing greenhouse warming, is increasing downwelling longwave radiation. It is DLR that warms the surface, and it is easy enough to detect.
But an increase in DLR has never been detected. Ergo, whatever warming the globe has experienced, has not been the result of greenhouse gasses.
Ralph
Yup, downwelling radiation was reported in Gero/Turner 2012 over the period 1997 – 2011. They found it was holding steady or decreasing.
If climate science was a real science we would have seen a few dozen sites around the world created to measure this and determine if this was a global phenomena. That this didn’t happen is absolute proof there is no such thing as climate science.
The range of 1.5 to 4.5 degrees C per doubling is based on two WAGs from the 1970s, the higher of which was by the astronomical Dr. Hansen. No actual scientific observation supports that high of a range. Hence, no evidence in favor of possibly dangerous future consequences. More CO2 is all good.
The real range is around the lab observed figure of 1.2 degrees C per doubling. What happens in the real climate system isn’t known, but the best estimates are something like 0.6 to 1.8 degrees C. Net negative feedbacks are more likely than positive, on our homeostatic water world.
Poor Mosh.. still pushing the same old used lemon.
There is NO CO2 warming signal in the satellite data sets.
There is NO CO2 warming signal in sea level
There is NO CO2 warming signal ANYWHERE.
It just DOESN’T EXIST except in models and purposely adjusted data (GISS, BEST etc)
The whole premise of CO2 warming is an unproven load of malarkey !!
Cartoons is ALL you have, Mosh.
I suspect several, people inside his cranium.
And he’d lucky if even one of them had any self-respect left.
Typical Progressive Taliban position… Declare something that suits your agenda to be “sacred” and thus “beyond question”, THEN start to discuss it’s implications and what to do about them. VERY CONVENIENT!
“Compromise” to a Progressive means negotiating the various ways to ultimately promote the Progressive agenda. How convenient!
“…Ah no. Nobody argues that the records PROVE.. DANGEROUS man made warming…”
Plenty of politicians, activists, and brain-washed members of the general public do. Why aren’t the climate scientists out there correcting them? Why aren’t you (not as a climate scientist, of course)?
Please explain how the small fraction of the (already puny) .0004 atmospheric C02 budget (that is reckoned to be human-made) can have anywhere near such a powerful effect. Especially considering that it competes with H2O in trying to absorb the two limited bandwidths of reflected solar radiation that it can “capture.” Given that the H2O to CO2 ratio is about 19:1 it seems a mighty stretch. Then please comment on the work done that demonstrates CO2’s logarithmic (and not linear) effect which displays diminishing returns for contributing to atmospheric heating and the eventual flat-lining of its effect (as logarithmic contributions do.) Does this effect not comport better with the real world observations, or at least come MUCH closer than those historically unforgivable wastes of billions of dollars, known as climate models?!
Steven,
Whilst ever there is an abnormally high level of CO2 in the air, your hypotheses claim this will generate extra warmth. If you claim this display of warmth is erratic, you have to have a hypothesis to explain where it resides during a short term low. Then, if you have a candidate you have to measure whether it has the physics to handle that much warmth, then you have to produce numbers, with uncertainty bounds, to show it is a plausible mechanism.
So, where is warmth stored when it is erratically cool and where is cool stored when it is erratically hot? Do the thermodynamics balance? Are measurement errors low enough to tell? Geoff
YOU ARE DREAMING Mosh
I Irrelevant
P People
C Creating
C Chaos
There is no consensus and no proof that so called GHG will warm the world beyond natural variations.
The activist scientists argued that action had to be taken because of the precautionary principle in case they were right .They used dodgy methods and manipulated temperature records to suit their purpose .The politicians accepted the argument because they were told that 2500 scientists can’t be wrong and 97%of climate scientists believed in CAGW .
“1. If we continue to dump c02, we expect temperature to generally increase,”
Increasing CO2 concentration will only shorten the path of a very minor wavelength from maybe 10 meters to 9 meters in the atmosphere (if there is no water vapour in that area). This is what physically happens. This does not automatically translate into general temperature increase.
This physical process including the heat transfer through the air column is not build in the models. Models work with a simplified version where a certain backradiation is supposed to appear at the top of the atmosphere thought to replace the whole physical process.
Is this substitution valid?
“2. How much? How much depends on several things.”
First how valid is this substitution? I doubt it has any real value, over the history we see that temperature can decrease when CO2 is high, therefore CO2 is not a main driver of temperature. The ocean currents and continental setup + solar influence seem to be main drivers
What other influences is CO2 having?
– reduces desertification – plant can withstand more drought
– increases C3 plants metabolism
http://www.co2science.org/data/plant_growth/plantgrowth.php
=> about 15% to 20% of increased food production for CO2 increase from 280 ppm to 400 ppm. ABout 40% increased food production for CO2 increase from 180 ppm to 400 ppm.
Without the additional CO2 we would be starving.
From https://www.lifesitenews.com/news/climate-change-alarmists-disregard-sanctity-of-human-life-population-expert
… The bestselling author, who went through a Ph.D program in Oceanography at the University of Washington, further noted that during the Jurassic period, the earth was 15 degrees warmer on average than it is today.
Mosher, who received the Blessed Frederic Ozanam award from the Society of Catholic Social Scientists for “exemplifying the ideal of Catholic social action,” mentioned that meteorologist Anthony Watts has tallied government payouts related to global warming. Watts estimates $1.5 trillion to $2 trillion are “tied up in the climate hoax.”
Mosher criticized Ehrlich for his extremist view of population growth and for “comparing it to a cancerous growth. I can hardly imagine a more derogatory description of the human family than comparing it to a cancer cell,” Mosher said.

“When my wife and I had nine children, we didn’t think that they resembled cancer cells. We thought that we were new souls into existence, cooperating with God in populating this world and hopefully in the next,” Mosher commented.
Not „Mosh“!
Thanks for the clarification. I wasn’t sure if Mosh had finally seen the light, or if it was his skeptical twin declaring the truth. :>)
I for one commend Steven Mosher for speaking up on behalf of the family and of humanity. The world cannot be made better by removing love and family from it.
Thank you Steven!
Mosher writes
Future warming isn’t dangerous with a question of how dangerous. Not all change is dangerous. Future warming is likely and the result could be anywhere from very dangerous to very beneficial.
Data schmeta, nothing the Mann adjustment bureau can’t fix
I have been looking at this SST web page, daily for about as long as it has been on the internet.
http://www.ssec.wisc.edu/data/sst/latest_sst.gif
Is it outdated or incorrect?
The NOAA imagery in the article shows SST Anomalies. So no, your SST map is not necessarily outdated or incorrect.
Graphical depiction of Sea Surface Temperature gridded products. Contour charts are used to depict both global and regional SST values in various grid spacing.
http://www.ospo.noaa.gov/data/sst/contour/global.c.gif
I find this one easier to read, esp when looking for the shape of the temp gradient.
http://www.amssm.org/a_31_yearold_runner_with-a-csa-160.html
Hmm. Paste failed entirely. Sorry.
Global temperatures have been going down since February 2016 when the big 2014-16 El Niño peaked. The cooling has been so slow that after a year and a half they are still at the level of mid-2015, so it is cooling at less than half the rate of the previous El Niño warming.
It will be quite a long time before this cooling is a problem for the AGW hypothesis, as so far some cooling after the El Niño is to be expected. Perhaps by 2020 if the cooling continues that long and we are back to 2013 temperatures.

Those are fake “data”.
But, yes, the lower troposphere does seem to be cooling somewhat more slowly than after the 1999 Super El Nino.
http://www.drroyspencer.com/wp-content/uploads/UAH_LT_1979_thru_September_2017_v6-550×317.jpg
There were minor El Nino conditions from Mayish to July and there is a two month lag with the troposphere temperature I believe. The flip to La Nina should start showing up with this month’s data.
Just on the basis of Sept being anomalously warm, I expect a cooler October. But Earth is always full of surprises.
The Arctic ocean has had a relatively large extent of open water for the last few years and has subsequently dumped a great deal of heat. The water temps are now sufficiently low that seasonal ice extents are growing. This growth will continue for at least the next 10 years, with the Arctic climate reverting from a marine (warmer) dominated condition to a colder, drier dominance. This colder Arctic will profoundly effect temps and precipitation across the Northern Hemisphere. The AGW hypothesis is going to freeze to death, but we can’t be complacent about this. They have demonstrated that they will use any extent of false witness to advance their eco-Socialist cause.
AGW is not science, it is politics!
We are headed for 1960’s type weather in the NH, until the Arctic ocean builds up enough heat to create a new open water paradigm. Probably 30-40 years from now.
Good thing you know what future climate is going to be several decades in advance. Keep that crystal ball clean.
Over the years I have seen numerous skeptics predicting a serious cooling around the corner and failing, so yes, I am skeptic of that too. I only believe what I see in the evidence. Less warming than promised, but no cooling so far. And the future continues being unknown to all.
Javier,
IMO we can pretty safely predict that Earth will be cooler in the future than now. I believe that your estimate for the next glacial advance is around 3000 years. Others, who think that orbital eccentricity rules, say not for some 30,000 or more years.
But, you’re right. No one can say with any confidence that Earth will be cooler 30 years from now than it is presently.
But IMO that’s the way to bet, given climate history.
Javier +1
I’d like to point out upwelling does not make joules disappear, it just hides them for a while. On the contrary. But warming means warmer baseline to start El Ninos.
Agree with John we could have Arctic refreezing, but while it makes Wadhams more and more laughable, it does not nail the coffin of agw.
Hugs,
IMO growing Arctic sea ice will help end the AGW madness. Gore always asks what else could be causing the decline. If there is no more decline, one of the most visible examples of putative GHE is gone.
Gabro,
Yes, and warmer too. But without getting the timing right it is quite irrelevant.
I guess most people don’t get a clear grasp of the temporal scale of climate changes, since our lives are so short within the geological scale. The Roman “peak” lasted several centuries, and the Medieval “peak,” that was shorter, lasted one to two centuries. We may have not reached yet the Modern “peak” that could very well last a few centuries too.
Those awaiting a sudden profound cooling LIA-style might as well be waiting for the second coming of Jesus in practical terms. The LIA was a pretty unique event in the Holocene, and the Holocene is a very long period in human terms. Our entire history since writing was invented fits comfortably in the second half of the Holocene. The 2400-year solar cycle fits half of our history within one oscillation. That’s about 100 human generations right there. According to paleoclimatology, the conditions for an important cooling within our lifetime are simply not there, and it makes me very happy to think so. Barring very strong volcanic activity or an asteroid hit we are probably looking at a long period of general climatic stability with multidecadal oscillations of the order seen in the second half of the 20th century (1950-75 cooling, 1976-2003 warming).
In political terms the best people here can hope for is lack of progress in global warming for the next couple of decades. For some, a cold, snowy Northern Hemisphere 2017-18 winter that furthers the temperature decline seen since Feb 2016 might be enough. Those that like skiing might be readying for a better than average season.
And we always have to be aware that future climate and weather remains unknown, for us as much as for 97% of climate scientists. We just have possibilities.
Javier,
I agree that it’s probably too soon for another LIA.
However, the LIA wasn’t unique. It might or might not have been the coldest such interval in the Holocene, but it was preceded by other similar cool periods in between the warm cycles.
The long-term trend however is down. The Current Warm Period hasn’t yet reversed the cooling trend since at least the Minoan WP. So far, as you note, subsequent WPs have been less warm than the preceding ones at roughly 1000-year peak intervals.
i agree with that javier, but a similar period to that of the 1950 to 1975 period would surely be multiple nails in the cagw coffin ? now we are past the peak of the amo the northern hemisphere should surely see some cooling over the next two decades along with an increase in arctic ice for the reasons mentioned by john harmsworth. both would fly in the face of warmist propaganda.
There’s plenty of evidence for an approximately 60 year cyclicality. Fudged records don’t change the reality that the 30’s were probably just as hot as the 1985-95 period. We have had 18 years of no warming. Arctic ice is growing, it is cooling and will continue to do so. Arctic ice conditions control the lag that causes this cyclicality.
Javier writes
Especially when it comes to considerations of sea level rise.
My understanding of La Niña conditions are that Pacific SSTs decrease because sun-warmed surface water is blown toward the western side of the Pacific by strong trade winds, where the warm water piles up, storing heat. When the trade winds slacken, the piled-up warm water spreads out over the ocean surface again and radiates heat as an El Niño. The AGW part comes in when the GHG molecules in the atmosphere scatter that released ocean warmth, leading to the next step up in surface warming. During a positive PDO, dominant El Niños creates a ramp-up in warming (1910-45; 1975-2000). During a negative PDO a dominance of La Nina’s causes more heat to be stored in the ocean than released, so there is a hiatus or pause in the rise of global surface temperatures. If this summary of events is correct, ocean warming and cooling cycles are compatible with and do not disprove AGW theory. Rates of warming vary with ocean cycles, but overall a gradual surface and tropospheric warming occurs in response to more of the periodically released ocean heat being trapped by the increasing GHGs in the atmosphere. The summary above pertains mainly to the Pacific but of course the Atlantic has its own cycles. For example the currently cooling N Atlantic (increasingly negative AMO) may help Arctic sea ice to increase, reducing that positive warming feedback in the NH. If this interpretation of some of the interactions between ocean cycles and GHGs to cause AGW is wrong I would appreciate clarification from anyone willing to take the time.
There is a lot of water vapor (up to 40,000 ppm) in the air above the tropical Pacific, and other parts of it as well. Thus, a fourth molecule of CO2 per 10,000 dry air molecules (400 v 300 ppm a century ago) has very little if any GHE.
It is also possible that net heat discharge darkens the globe allowing greater solar absorption. MIT published something about that in 2014. Inconveniently, Earth started to shine up again.
I look at it a bit differently currently. Antarctica in the winter pushes out very cold water in the winter that is extremely dense and sinks and later comes up somewhere. The thermocline keeps warm water and cold water apart, this has especially strong recently – some say it is because of the AGW but to me it is the cause of it. If this weakens and the cool water pushes through and starts to cool the surface, reducing water vapour and cooling the planet. Water vapour outclasses CO2 as a GHG by a extremely large margin which is why some climate scientists talk about feedback mechanisms which water vapour is the main feedback that when temperatures go up it will push water vapour into the atmosphere and therefore push temperatures up in a runaway style. Which isn’t how the world works otherwise Earth would be like Venus already. My understanding is El Nino’s are warmer water at the surface that releases more water vapour than normal which warms the planet, El Nina’s are cold water at the surface that releases less water vapour and cools the planet. I view it more as how much cold water is getting to the surface. This ocean dynamic is why we have been in an ice age for the past 2.6 million years. (should have put it here as a reply, not fast enough, by the time I wrote it there was already many above)
What is so special about the GHG effect? It’s much smaller than the translational kinetic energy that all gas molecules transmit through the atmosphere from heating at the surface as well as adiabatic processes within the atmosphere. So therefore your statement about “The AGW part comes in when the GHG molecules in the atmosphere scatter that released ocean warmth” is narrow and misses the multitude of thermodynamic processes operating, and in a complex system like climate you can not simply isolate one variable. The major factor in ENSO related heating and cooling is the cirrus cloud anomalies and relative humidity anomaly during such events, not how much CO2 is present in the column of air above the outgoing radiation.
https://airs.jpl.nasa.gov/resources/nino-nina
As mentioned, this is all conjecture and hypothesis. We had no way to accurately know anything about air or water temperatures a hundred or more years ago and we know current data is fudged to make whoever is paying for the information a bit happier. The hottest weather in our lifetimes (if you are quite old) was back in the 1930’s. We have never seen it that hot since those times. All said, a bit of warming would be better for food production around the globe and it would allow our Canadian friends to perhaps start their migration to the south start a bit later and they could return a bit earlier – good for Canada – bad for USA GDP. LOL.
I live in central Maine and we’ve got enough cold as it is. I would like some global warming, man-made or natural.
More inconvenient truth flying in the face of the awarding of a certain Nobel [Junk] Science Prize.
Who cares? All of this has no effect on my life whatsoever. It’s all just a political distraction.
Before I went into the military, my dad gave several bits of advice that proved totally correct all my life. One of them was, “When the government builds a bandwagon and invites you to jump on, run as far away as you can before it goes over a cliff.” The government is always wrong. Once they jumped on human-caused global warming and actually refused to hire people who didn’t believe in it, I knew it was a lie. I didn’t need fancy charts or measurements. It was a lie on its face. Here’s what’s going to happen: the climate will stabilize or grow cooler and the Al Gores of the world will claim victory. Historians in the future will compare this hysteria to how humans tried to protect themselves from the black plague, with their Halloween masks, incense, animal sacrifices, and the rest. You can’t go wrong betting against the government.
Your father was a smart man. He didn’t happen to say anything about how to fix government, did he?
Global Temps use Mean , not Max. If they showed both Tmin and Tmax, they couldn’t scare anyone since invariably it is Tmin climbing much faster than Tmax and that is the UHI.signature.
https://sunshinehours.net/2017/10/28/national-post-tries-to-scare-canadians-and-fails-if-you-look-carefully/
Good point, which bears repeating.
And to the extent that there has been any open area warming, it’s higher lows in winter and at night. If the North Pole be two degrees warmer in its sunless winter, averaging, say, -32 instead of -34 C, it would have no climatic effect.
The one place on earth where more CO2 should have an effect is the high, dry polar desert of the South Pole, but there has been no warming there for as long as records have been kept.
There is another dry cold place where CO2 is showing an effect. Glaciers.
“The one place on earth where more CO2 should have an effect is the high, dry polar desert of the South Pole, but there has been no warming there for as long as records have been kept.”
Gabro:
Another man-made contribution to our atmosphere is at work over Antarctica, DEPLETING another GHG – O3, (Ozone) in the stratosphere.
http://sci-hub.bz/10.1038/ngeo1296
“The radiative forcing of the near-surface temperature gradient
is straightforward. Stratospheric ozone depletion is accompanied
by a reduction in downwelling longwave radiation through the
polar tropopause, and thus cooling in the polar troposphere and
an increase in the north–south temperature gradient near 60°S.
and…
http://sci-hub.bz/10.1038/nclimate2235
“We find that the SAM has undergone a progressive shift towards its positive phase since the fifteenth century, causing cooling of the main Antarctic continent at the same time that the Antarctic Peninsula has warmed.”
Javier,
Please explain how you suppose that CO2 affects glaciers. Thanks.
If it does, then they all should be behaving the same, but they aren’t. Some are growing, some are staying the same and some are retreating, although no faster than previously since the end of the LiA. Local conditions far outweigh any possible effect from a fourth molecule of CO2 in 10,000 dry air molecules, added over the past century.
Toneb,
Clearly the fluctuating ozone hole has had no effect, since it has waxed and waned, while CO2 has steadily increased, yet the temperature at the South Pole has stayed the same.
It’s also by no means clear that the ozone hole is entirely or at all anthropogenic in origin. Solar UV output varies enormously, especially in the highest energies which make and break ozone.
Fluctuations of ozone levels thus might well be mainly from natural variation, not man-made chemicals.
anyone that thinks the ozone hole over antarctica is caused by human activity is a complete lunatic.
One of the largest glacier fields on Earth is growing, with other smaller ones, too, of course.
https://www.technocracy.news/index.php/2017/08/14/scientists-karakoram-glaciers-growing-spite-global-warming/
I see zero CO2 signature in growth of glaciers in the 21st century v 20th or 19th century. But then my rice bowl isn’t dependent on CO2 warming.
i think the extrapolating algorerithms spreading uhi from over 1000km away in some cases may have a part to play as well. the majority of the increase in the northern hemisphere is due to the arctic warming. lets face it if there is anywhere outside antarctica on the planet that could use some warming it is the arctic.
Arctic warming is cyclical and arises as a consequence of open water. Check out the mean temp chart on the sea ice page for above 80 degrees N
It shows clearly that recent temps are much warmer than the older mean. This is best understood as the presence of a more marine environment as a result of low ice conditions. This massive heat dump by the Arctic ocean is the cause of most of our recent warming. That phase of the cycle is nearly complete. The Arctic ocean has cooled and the ice is growing. The Northern Hemisphere will now cool.
The Southern Hemisphere does it’s own thing, remaining a frigid island continent surrounded by ocean.
The backdrop for all this is a small continuing warming as we recovery from the LIA. That probably has to do with long term ocean currents. And the backdrop for that is our position in the longer term interglacial. which is just about the only climactic issue we really have.
And what’s that danger Mr Congressman? No more danger than we’ve had to endure since forever. Problem is more and more people and structures are getting in the way of Ma Nature, and so it goes.
I look at it a bit differently currently. Antarctica in the winter pushes out very cold water in the winter that is extremely dense and sinks and later comes up somewhere. The thermocline keeps warm water and cold water apart, this has especially strong recently – some say it is because of the AGW but to me it is the cause of it. If this weakens and the cool water pushes through and starts to cool the surface, reducing water vapour and cooling the planet. Water vapour outclasses CO2 as a GHG by a extremely large margin which is why some climate scientists talk about feedback mechanisms which water vapour is the main feedback that when temperatures go up it will push water vapour into the atmosphere and therefore push temperatures up in a runaway style. Which isn’t how the world works otherwise Earth would be like Venus already. My understanding is El Nino’s are warmer water at the surface that releases more water vapour than normal which warms the planet, El Nina’s are cold water at the surface that releases less water vapour and cools the planet. I view it more as how much cold water is getting to the surface. This ocean dynamic is why we have been in an ice age for the past 2.6 million years.
The Cenozoic Ice Age began about 34 million years ago, with build up of ice sheets on Antarctica, thanks to its separation by deep ocean channels from South America and Australia, ie the creation of the Southern Ocean.
This ice age spread to the Northern Hemisphere some 2.6 Ma, after North and South America were connected by the Isthmus of Panama, interrupting tropical oceanic circulation.
Trying to scare Canadians with nice summers and mild winters! That’s rich!
First off, Oceans do NOT rule the temperature of this planet. The Sun does and oceans can only moderate to some degree what the Sun does. The Maunder Minimum is back, which is a completely cyclic event. Add to that the Saturn & Jupiter are on the same side of the the Solar System (not the norm) and that is pulling earth further out away from the cooling sun. We are going into a mini Ice Age. The Russians think that this could last for several hundred years. And it if you have not been paying attention to the BS our of the Controlled Science, that cooling has already started … with significant crop losses last year in the US, which will only increase rather quickly in the coming years. Made made Global Warming is a Hoax put out for idiots by criminals (Gore included). Look back at the art of the1600s and you’ll notice how heavily everyone dressed to stay warm and all the days were rather dark/cloudy/cold. Get ready. That time is coming again. Ramifications? Less food globally and that means far few people can be supported, i.e. billions. Best to be at/near or below 30 degrees. In the US, that is only 2 states.
Gore bought a million plus dollar beach house. I don’t think he really believes the oceans will rise.
Follow the money. MMGW and Carbon Credits are tools to modify the global economy. They transfer wealth to less prosperous nations, and the very prosperous China.
We are heading into a cycle of lower solar output. What I haven’t seen mapped to the problem is the inclination of the Earth’s axis. And the axis perturbation rate. Or the magnetic field strengths across the globe. From those you can model the impact of solar output a touch better, but the model gains complexity as you have to determine UV bands intensities of the solar output to model upper atmospheric ozone and then the effects on albedo.
I think the total upper limit of the earths atmospheric temperature is bound by the volume of water on this planet. As ice caps melt, liquid water increases. Given the assumption that the solar input is relatively constant, the impact of said energy input has decreasing impact on the ocean temperature as more liquid water is added. At some point, the amount of solar energy is not sufficient to replace the outgoing energy, even under clear skies and full insolation. Throw in a cloud or two, a volcanic eruption, and cooling begins to take place. The inertia of the system insures that it continues to cool, or warm, depending on the direction. At some point, the oceans are at a negative, and begin to store heat again, reversing the system ….. and it goes back and forth, and temp up and down.
I don’t think the modelers have considered this aspect of climate. A said energy can only have so much effect on a certain volume of media. The direction can be changed in two ways, changing the energy source, or changing the volume of the media. Melting ice caps change the volume of the media.
Just an interesting thought.
It’s not just fluctuations in solar output that matters, but Earth’s orientation toward the incoming radiation and magnetic flux.
NH ice sheets melt when Earth is titled so as increase felt insolation. Meltwater pulses cool the oceans, interrupting deglaciation, put also their effect doesn’t last long. Maybe a millennium at most, like the Younger Dryas.
The Northern Dome of the Greenland Ice Sheet is too far north to be much affected even at tilt angles most favorable for melting. The Southern Dome is more vulnerable and can melt if an interglacial lasts long enough and gets warm enough. During the longer, warmer Eemian, it melted about 25% more than it has so far in the Holocene.
CO2 had practically no effect, except possibly as a feedback mechanism when warmer seas release more of it to the air.
“Given the assumption that the solar input is relatively constant” — False assumption. NOTHING but NOTHING is constant. Anything & Everything can & will change and that includes the sun, which is NOT a solar furnace as we’ve been FALSELY told. The sun is a ferrite/copper rock that is hurling through space a near 70,000K/second and pulling us along behind it. Space in front of the Sun is NO vacuum, only behind it because it is in essence leading us through this rather dense material in space and the interaction is like a Tig Welding tip. And the Sun is in the process of cooling from around 5,000K to around 3,000K. The material in front of the Sun is NOT constant either and It’s believed that we are going through more dense material than in the 1940s-1990s. Bottom line: NOTHING is permanent. And our knowledge about our existence is NO where near as complete as the powers that be would like us to think. The earth is going through some rather significant changes right now internally with the causality being rather complex and the sources are most likely interplanetary, not just the earth by itself. The most primitive form of rational is anthropomorphic which puts man at the center of everything, when in essence, man is rather insignificant, if not down right Stupid.
All this sientific stuff is great, but aren’t we all required by law to follow the thoughts and opinion of our great Climate Leadership team headed by Al Gore?
All governments are inherently a Criminal Enterprise by necessity, without exception! — Jordan Maxwell.
So are you going to follow/comply with Criminals? Our Founding Fathers had a different idea and warned us, but we’ve fallen down and lost control to this Criminal Federal Monster embodied by the Illuminati’s Federal Reserve & CIA, which they both created and run. Their IRS is just the FED’s collection agency. And As Eisenhower warned us in 1960, their Military Industrial Complex has completely taken over the Pentagon, which has ripped us OFF for many Trillions, giving us an almost constant state of WAR, which keeps their coffers full! Over 900 US military bases in over 150 countries is NOT defense. It’s Empire!
This year in Antarctica there is now more ice than a year ago.
I should hope so!
Last year was off the scale low in November and December, due to two weather events.
According to NOAA, it’s in the normal range and headed for the 1981-2010 median:
http://nsidc.org/arcticseaicenews/charctic-interactive-sea-ice-graph/
http://www.woodfortrees.org/plot/hadsst3gl/last:360/offset/plot/hadsst3gl/last:360/mean:25/offset
Hadley Centre “data” are fake.
what a joke
Yep, Hadley, GISSSSS.
WHAT A JOKE they are !!
Gabro
Yet this is the very data set used by the author of the above article to proclaim that global cooling has begun.
What way does this work exactly? Where a data set shows cooling we should accept it without question; but where the very same data set shows warming we should regard the entire set as “fake”? That doesn’t really work, logically. It lacks any kind of consistency.
Another thing: if *they* are faking the data to make it look like there’s continued global warming, then why have they introduced a cooling trend since Feb 2016? If it’s fake they could simply brush the cooling out. Why are the ‘warmists’ faking cool data?
Two things:
How long does it have to cook and I’m having trouble measuring .2 degrees.
“With update thru September, ~80% chance of 2017 being 2nd warmest yr in the GISTEMP analysis (~20% for 3rd warmest).”
Only 2nd warmest? I thought every successive year was supposed to be the hottest evah!
Most will never admit it if a lot of the “science” and “facts” about “global warming” turn out to be a bunch of bologna. Severe cerebral narcissists with a constant snide attitude towards anyone who does not blindly believe as they do. But this reveals that they are the ones who are so desperately terrified of being mere fallible mortals, capable of having wrong guesses or needing to ever adapt their perceptions. They regard it as some horrific and shameful thing to be demonized and aggressively ridiculed. It’s really sad, they are trapped by their own warped fear of being human.
Put a cork in it you warming freaks….the oceans have spoken….LOL
Exactly!!
+10
They have lied to us before, why should we trust them now?
With all the artificial “hockey stick” adjustments to the past (cooler) and present (hotter), I wonder if we should potentially be alarmed by a minor cooling trend in the present and near future…
“Yet HadSST3 data for the last two years show how obvious is the ocean’s governing of global average temperatures.”
I’m not sure what that means. Arithmetically, most of GAT is SST.
In march I was saying: “Given the El Nina peaked around December 2016, this suggests that there’s around a 70% chance of another La Nina peaking around February 2018.”
http://scottishsceptic.co.uk/2017/03/03/el-nino-versus-arctic-temperatures/
http://www.ndbc.noaa.gov
Not sure why people are so stupid about this. Look at the buoy locations. Its IMPOSSIBLE to have accurate data when 97% of all temp readings come from the equitorial band or northern hemisphere. Plus consentrations near population centers. I called the NOAA and their are NO methods to balance out the lack of southern data.
These are not the buoys you are looking for. Here are the drifter buoys.
Thank u for that. I wrote to the noaa and still have the email. These drifter buoys were not part of their analysis. that said this would make more sense.
First of all, Anthony, you can’t just plop facts and real-world charts in front of the Greenbeans and Warmians. You will make their heads explode, and I don’t want to clean up that mess.
Second, I see that the ENSO meter is teetering on the edge of -0.5, which says the water is definitely cooler, which is — well, it’s just unfair to them.
Third, the sun is still blank, showing low activity and I guess this solar minimum is going to last considerably longer than the previous one that started – what? 11? years ago and didn’t ramp up as expected. So does that mean buy more bird food and stock the pantry more? Or just make sure I have enough chocolate chips for five batches?
I’m still not sure what the quarrel has ever been about, other than the grasping greed for grant cash, which will probably never end until or unless one of those blighted souls in the Warmian section gets buried under the snow falling off his roof in July (in the northern hemisphere, of course). And even then, because denial of reality is a mental disorder, he’ll just say it was caused by more global warming.
So I really do appreciate your efforts to keep this stuff in front of us. It appears that winter in my kingdom may have an early start, per what the Farmers Almanac and the Old Farmers Almanac are saying – snow in November: not unusual, but not necessarily wanted so early. I hope that some day, this utter nonsense involved in turning science that can benefit all of us into political claptrap will come to an end. Thank you.
I always enjoy understatement.
that warmth is devilish it seems at first it was hiding in the oceans rather than warming the atmosphere for the last 20 years and now it is morphing into cooler temperatures to cover its tracks…….one thought from my youth it seemed sodas held their co2 pretty good when very cold but lost it fast when warmer, the oceans being cooler means less co2 being outgassed from the oceans.
Steven Mosher October 28, 2017 at 9:12 am
1. If we continue to dump c02, we expect temperature to generally increase
if we hold everything else equal, then we expect between 1.5 and 4.5C of warming
for a doubling of c02, OVER THE LONG TERM.
–
–
Has to be called out.
For vagueness.
Fudging.
If we hold everything else equal i.e. ignore all the other real things that happen in the world but OK make it a textbook science problem
–
–
CO2, doubled, time irrelevant (constant conditions remember)
Increase in temp equals X C of warming.
But X is not known??
We have knowledge of all the conditions, starting and finishing, constant remember.
Time is irrelevant, remember.
Formula for effect of CO2 doubling is known, yes?
Hence X can have only one known answer.
We don’t expect anything, we don’t use expectations or guesses.
We do not guess constraints on our guesses, 1.5 to 4.5 ???
Why constrain a guess so precisely?
We use the science if we are going to make scientific statements.
We use guff when we want to make political, self fooling statements.
All that knowledge and still only a range as wide as the Pacific Ocean.
“All that knowledge and still only a range as wide as the Pacific Ocean.”
And “they” STILL keep missing, except by a fluke.
Mosh needs better aim with his wee.
The science is settled. It’s just the numbers that keep needing reworking.And sometimes the signs. Just the numbers and the signs. That’s all. And the dates. Sometimes the dates don’t work and we have to use the Mann-fudge-o-matic.
Then it all comes together like grants at Christmas time!
1 degree C is 34 degrees F. The temp has not changed that much. We’ve always had 90+ degree summers. This seems to say summers should be 120+ degee summers. I don’t know what this graph represents.
Oh, I thought they got boiled off already.
This post is about a one-off drop of about 0.2°C in the September HADSST3. August and earlier were quite warm. NOAA SST showed a much smaller drop of 0.06°C. That still makes September the coolest of 2017, but just above Dec 2016. I think the heading of this post has it wrong. Let’s see what October brings. Globally, it is pretty warm.
“Globally, it is pretty warm.”
RUBBISH, as usual Nick.
It is cooler than all but a short period during the Little Ice Age. and the period 1950-1980.
There is NO CO2 warming signature in the satellite temperature data.
There is NO COI2 warming signature in sea level rise.
There is NO CO2 warming signature ANYWHERE. !!
Just a SLIGHT natural solar and ocean based warming from the COLDEST period in the last 10,000 years.
Tell me Nick, why do you always bury an insidious LIE inside everything you post ??
Do you have NO SHAME ???
I rarely bother replying to your stuff. You don’t read, you don’t think; just reflexive, all-purpose shouting.
This is a thread about a reduction in HADSST3 going from August to September, which brings it to a low point for two years. It isn’t about the last 10000 years, or the LIA. I pointed out that NOAA shows a smaller reduction, and so far, October 2017 is pretty warm. I linked to the daily temperatures for October. Your responses show no awareness of any of that. They make no contribution to the discussion.
“I rarely bother replying to your stuff”
ROFLMAO
I’m not surprised.
You KNOW that
There is NO CO2 warming signature in the satellite temperature data.
There is NO COI2 warming signature in sea level rise.
There is NO CO2 warming signature ANYWHERE. !!
Running and hiding is what you do.
“Your responses show no awareness of any of that.”
I am very aware that a cooling trend appears to be starting……. are you ???
“October 2017 is pretty warm”
There’s the LIE again. Or is it just ignorance?
Current temperatures are COOL compared to most of the rest of the last 10,000 years
WHY do you continue to push your LIES , Nick. !!
” It isn’t about the last 10000 years, or the LIA.”
CON-veniently IGNORED, hey Nick. !
Come on, I DARE you to admit that the current temperature is only just a small amount above the COLDEST period in the last 10,000 years.
Can you tell the truth………, or NOT
Nick’s absence from the TRUTH is duly noted. !!
Keep your SHAMELESS support of the AGW agenda against modern civilisation, Nick.
Keep your SHAMELESS DENIAL of the “cool” reality.
Stick it where it belongs.
“Globally, it is pretty warm.”
Sorry Nick, I don’t bother reading blatant AGW propaganda sites.
They have NOTHING to offer to rational discussion.
The warmest temperature data set last month was UAH satellite TLT v6.. The rate of warming in UAH TLT v.6 over the past 10 years (from the start of 2008) is faster than that of HadCRUT4 and only slightly slower than GISS: http://www.ysbl.york.ac.uk/~cowtan/applets/trend/trend.html
Is UAH now a part of the ‘big conspiracy’?
Yawn, Duuur still doesn’t know about El Nino transients.. duuur !!!
Not the warmest by far.
MWP, RWP, Holocene optimum, all warmer by far.
Come on Duuuuuur, I dare you to admit to the fact that the world is only a small, highly beneficial amount above the coldest period in 10,000 years
You can do it.. don’t be a worm !!
The rate of warming in UAH without the recent El Nino spike (non-anthropogenic, nothing to do with CO2
….. has been ZERO since 2001 at the end of the last El Nino.
The ONLY warming in the satellite data has come from NON-ANTHROPOGENIC El Nino ocean effects.
If you are “duuur” enough to think El Ninos are caused by humans.. then they really is nothing that can help your ignorance, is there.
“This post is about a one-off drop of about 0.2°C in the September HADSST3”
WOW…
That’s nearly a QUARTER of the natural warming in the last 100 or so years..
……… LOST in one month !!!!!
WOW !!!
Holy Guacamole! Was that a Mastodon I just saw traipsing across my backyard! Best call Algore and let him know…
2nd warmest year… lol.
Got any proof of the green house gas effect at the macro level in a 70+% nitrogen environment?
That’s weird. I didn’t write the post above which is attributed to “TA”. I guess there are two of us now.
It would be nice if the left would at least come to the realization that science is not a perfect art but full of hypothesis. Money now drives the climate science and they are not inclusive of differing thoughts on their “settled” science.
Amazing how many Doomsday True Believers and Pay-To-Pollute Carbon Credit Con defenders there are.
I remember the Ice Age, Overpopulation, and Continents Will Sink Into The Ocean from Earthquakes fads in the 70’s. No different than late night radio ghost story, UFOs, Big Foot, Chupacabra crowd.
Why does Gavin look so much like Mann? Seriously… anyone?
ugh, compare Gav’s stations used in analysis, comare it to the output anomaly map and you see all the warming to set records for the last few years come from places where they have no station data.
This is a ridiculously bad state of affairs. It’s certainly not science.
Image link

you gotta be flipping kidding me, GISS is a bad joke and what is interesting is, now the other surface data sets track GISS #collusion
Yes the anomalies may be smaller but the trends..
Of course this is in part because they use the same utterly flawed and massively adjusted underlying data
Look at how much red comes from thin air.
[???? .mod]
Smear Smear Smear Smear Smear Smear Smear Smear Smear Smear Smear Smear Smear Smear Smear Smear Smear Smear Smear Smear Smear Smear Smear Smear Smear Smear Smear Smear Smear Smear Smear Smear Smear Smear Smear Smear Smear Smear Smear Smear Smear Smear Smear Smear Smear Smear Smear Smear Smear Smear Smear Smear Smear Smear Smear Smear Smear Smear Smear Smear
Zeke warming data as it moves south when they lose stations when they are supposed to cool it 1 degree per degree south of latitude move
BEST is anything but
D*mn this global warming!!!!
Liars i live in north east i can name 40 years hotter then last 5.
Guys no one believes u anymore.
Excerpted from above published commentary:
“YUP”, and the temperature of the ocean waters rule the variable atmospheric CO2 ppm quantities, ….. both the bi-yearly and yearly ppm variations.
And iffen those “cool waters” materializes into a La Niña then it will result in a noticeable decrease in the Average 2-4 ppm Yearly Increase in Atmospheric CO2.
Given cool to cold La Nina temperatures, the ocean water in the Southern Hemisphere will “curb” their summertime outgassing of CO2.