
SRM Analysis
Clean up, clean up
I spent the last few days cleaning my Skyline data. Here’s what I did:
- Create a new Skyline document with just my sample files
- Used my sequence file to make sure I had all of my data
- Remove sample files that had no data
- Files 3, 16, 22, 34 and 88 had no data in them, even though I did not encounter these problems when I was looking at their RAW files during my mass spectrometer run. All files recorded PRTC peptides but not my sample peptides


Figures 1-6. Files with no data present
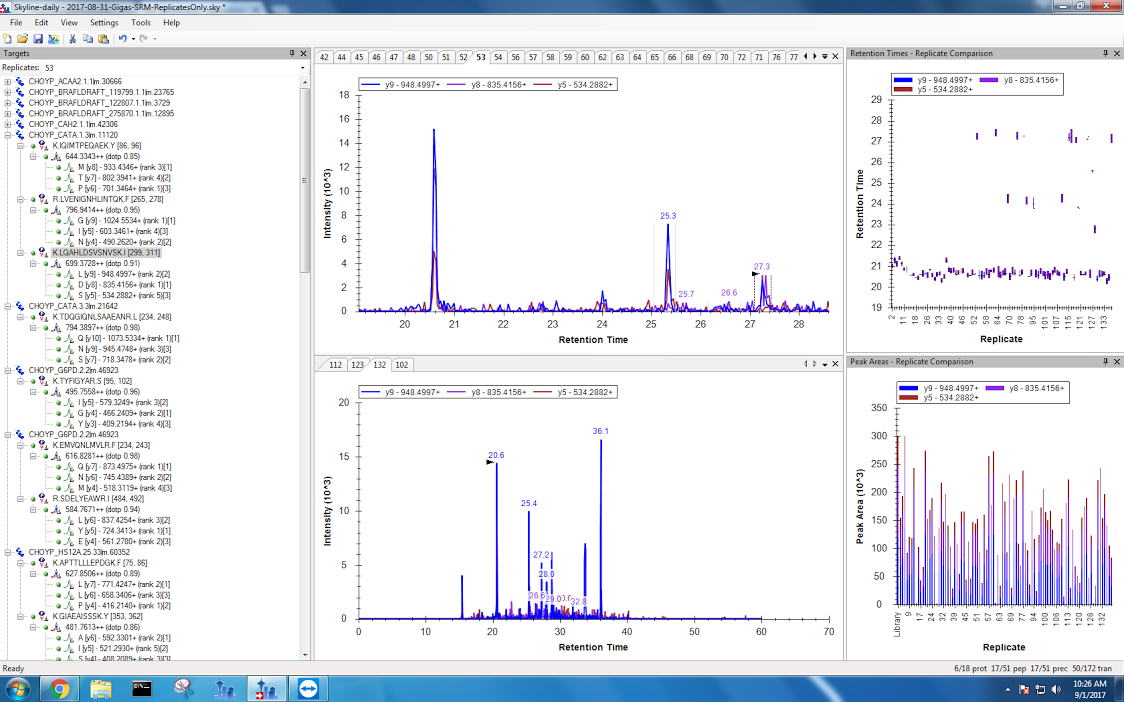
- Ensure Skyline selected the correct peak
- I used the retention times I calculated earlier to find the correct peak in file 2. I then used “Apply All” to have Skyline use the correct peak for all data files
- Quality checked selected peaks
- I found that even after using “Apply All”, Skyline made plenty of mistakes! For each peptide, I went through all of the sample files to make sure Skyline actually did identify the right peak. Some peptides had more incorrect peaks than others. I think my transitions that were cleaner in the DIA document had much higher success rate for correct peak selection. This is something that would be interesting to follow up on! For each incorrect peak, I took a screenshot and saved them here. I can use this information to produce an error rate like I did for my DIA document.
- Skyline has a problem selecting the correct peak in the following situations
- When the correct peak is much less intense than other peak


Figures 7-8. Incorrect peaks selected by Skyline (top panel) compared with the correct peak in a different sample (bottom panel). I believe this happened because the incorrect peak has a higher intensity than the correct peak
- When the correct peak doesn't exist. In this case, I right-clicked and selected "Remove Peak." This happened most often with files 14, 27, 60 and 127.


Figures 9-11. Examples where a sample did not have the desired peak.
- When it's just being dumb


Figures 12-15. #SkylineFails
- Fixed peak boundaries
While going through my data for the PRTC peptides, I noticed that there seemed to be a batch effect. I would expect all peptide abundances to be uniform between my samples since I added the same about of PRTC to each sample. However, some samples had higher abundances of PRTC peptides than others. The batch effects aren’t as pronounced as Laura’s samples and seem to vary in intensity between each peptide. I will need to talk to Emma to figure out how to analyze my data. I’m wondering if I have to use the same normalization method Laura did even though my abundance differences aren’t as stark.


Figures 16-25. PRTC abudances for each peptide.
Another thing I noticed with the PRTC peptides is that some peptides have much sloppier peaks than others. Not sure if this is something I should also refine, or if I should trust Skyline to pick the right PRTC peaks. Again, I’ll ask Emma!


Figures 26-32. Sloppy peaks from PRTC peptides.
Finally, I exported my data. I have two files: without pivoting replicates and with a pivot. The settings I used are now saved as “SRM-Gigas-Report” and can be seen below:
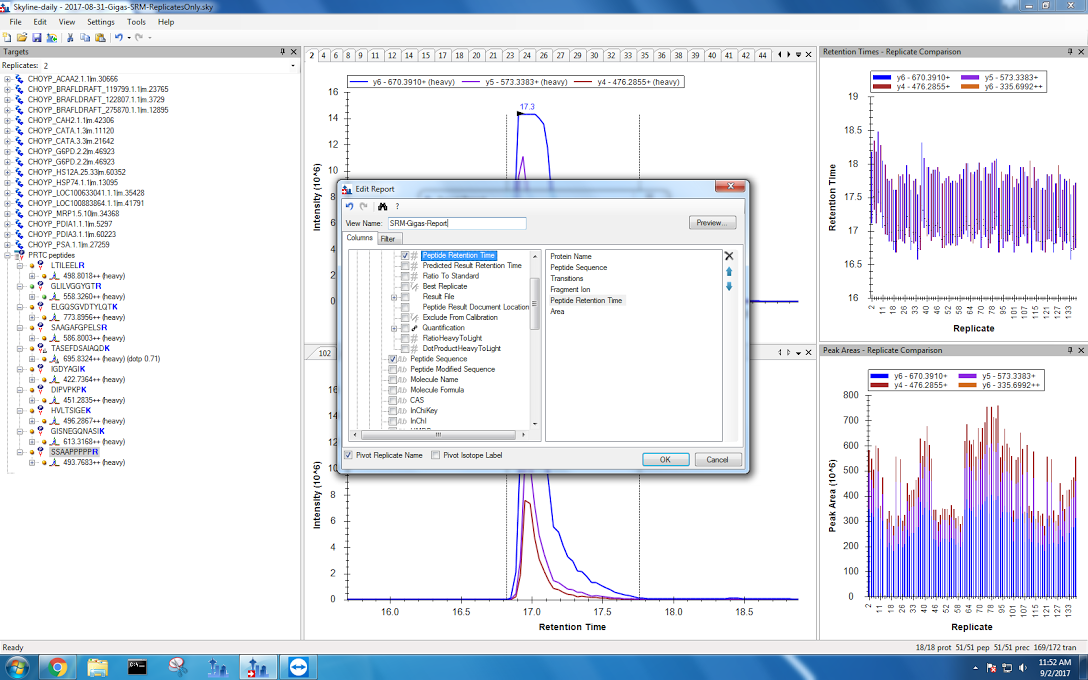
Now it’s time to do some stats.