Urban Ascendant: Home Values in and Around Washington, D.C.
The housing market in and around Washington, D.C., has fundamentally transformed over the past decade. Perhaps more than any other U.S. market, the nation’s capital sharply illustrates the extent of urban renaissance experienced in many cities nationwide, and the diverging post-Recession fortunes of the nation’s urban and suburban communities.
- Since the onset of the Great Recession, home value growth within the District of Columbia has outpaced home value growth in the D.C. suburbs.
- At the start of the Bush Administration, DC homes were worth 14 percent less than homes in the nearby suburbs; now they are worth 27 percent more.
- Since 2012, the historically less affluent Northeast and Southwest quadrants have led the District of Columbia in home value appreciation.
 The housing market in and around Washington, D.C., has fundamentally transformed over the past decade. Perhaps more than any other U.S. market, the nation’s capital sharply illustrates the extent of urban renaissance experienced in many cities nationwide, and the diverging post-Recession fortunes of the nation’s urban and suburban communities.
Until recently, the Washington, D.C. area was a study of contrasts. Leafy, upscale neighborhoods like Georgetown and gleaming suburbs like Arlington, Virginia and Bethesda, Maryland stood in stark contrast to the majority of the District itself. This “other” D.C. was particularly hard-hit in the 1980s and 1990s by a combination of drugs, crime, AIDS and systematic underinvestment in communities of color.
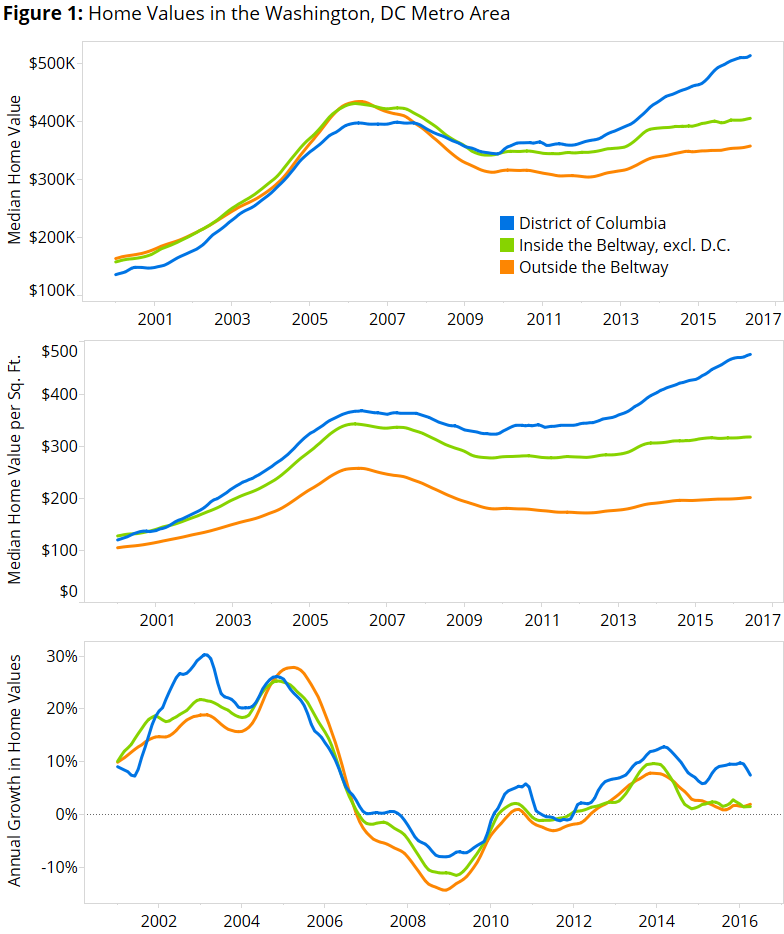
In January 2001, when George W. Bush first assumed the presidency, the median home in the District of Columbia was worth $148,500. This was 15 percent less than the typical home in the nearby suburbs inside the Capital Beltway – the 64-mile interstate surrounding the city and its nearest suburbs in Maryland and Virginia – and 18 percent less than homes in suburbs beyond the Beltway (figure 1).
Today, homes in the District of Columbia are 27 percent more expensive than homes inside the Beltway but not in the District, and 44 percent more expensive than homes outside the Beltway. Per square foot, homes in the District were 2 percent less expensive than homes in the nearby suburbs at the start of the Bush Administration, but are now 50 percent more expensive than other homes inside the Beltway.
Two periods in particular account for the widening gap between home values in the District of Columbia and its suburbs.
First, the federal government’s first-time home buyer tax credits in 2009 and 2010 had a much larger effect on home values in the District of Columbia than in its suburbs. Between September 2009 and August 2010, median home values in the District of Columbia rose 5.3 percent, from $344,900 to $363,200. Over the same time, home values in the close-in suburbs inside the Beltway increased 2 percent (from $341,900 to $348,700); beyond the Beltway, home values increased 1.1 percent (from $312,300 to $315,800).
Second, and perhaps more dramatically, home value growth in the District of Columbia has strongly outpaced home value growth in the suburbs over the past three years. The median home value in the District of Columbia rose 19 percent from the end of 2013 through today. Over the same period, home values in the inner-Beltway suburbs rose 4 percent; outside the Beltway, the median home value is up 5 percent. Since December 2013, home value growth in the suburbs overall – both inside and outside the Beltway – has averaged 4 percent per year. Inside the District of Columbia, home value growth has averaged 9 percent per year over the same time, more than double the suburban pace.
Drawn and Quartered
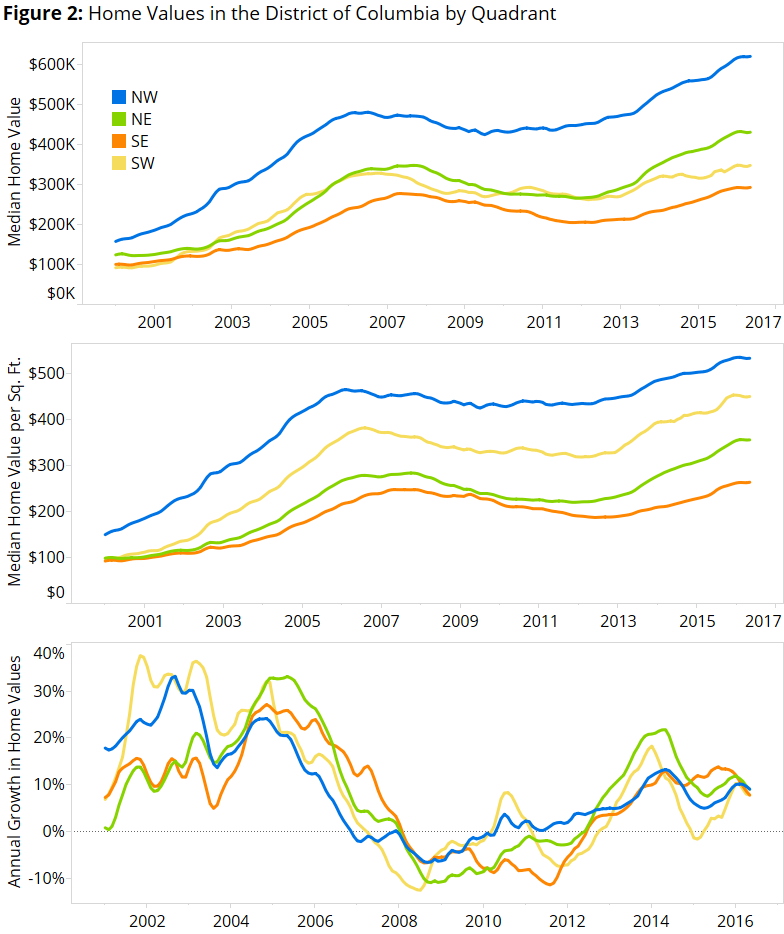 The District of Columbia itself is organized into four quadrants with sharply different incomes and demographics. Historically, the Northwest (NW) quadrant – which includes the toney neighborhoods of Georgetown, Foggy Bottom, Embassy Row and Kalorama (soon to be the home of President Obama), among others – has been the most affluent. But over the past half-decade, home values have been on the rise elsewhere in the District (figure 2). The Northeast (NE) quadrant is home to rapidly gentrifying, and rapidly appreciating, neighborhoods including Eckington and NOMA (North of Massachusetts Avenue). Home values in neighborhoods that straddle the border between the Northwest and Northeast quadrants have appreciated particularly quickly. In spring 2015 the median home value per square foot in the Bloomingdale neighborhood – south of Howard University, bordering the two northern quadrants – surpassed the median home value per square foot in the historically more affluent Northwest neighborhood of Cathedral Heights for the first time.
The Southwest (SW) quadrant, until recently dominated by federal offices, has also experienced strong home value growth in the wake of major redevelopment efforts surrounding the Southwest Waterfront and Nationals Park, home of the city’s Major League Baseball franchise. The Southeast (SE) quadrant has also experienced rapid home value appreciation in popular neighborhoods such as Capitol Hill and Eastern Market, and surrounding new developments like Navy Yard. But broad swathes of the Southeast quadrant across the Anacostia River have not experienced the same degree of home value appreciation as elsewhere in DC.
In January 2000, the median home in the Northwest quadrant was worth $150 per square foot, 52 percent more than the median home in the Northeast quadrant ($99 per square foot) (figure 2). Today, the gap is much smaller. The median home in the Northwest quadrant is worth $533 per square foot, 18 percent more than the median home in the Northeast quadrant ($450 per square foot).
During the housing bust, home values in Northwest DC hardly dropped at all, and have since increased strongly. More recently, until mid-2013, home values in the Northeast and Southwest quadrants were roughly similar. Since then, home values in the Northeast quadrant have increased by 40 percent while home values in the Southwest quadrant have increased 19 percent. Between late 2012 and late 2014, annual home value appreciation in the Northeast quadrant was fastest among the four quadrants – peaking at 22 percent in May 2014, more than double the pace of appreciation observed elsewhere. For much of 2015, homes in the Southeast quadrant were appreciating twice as fast as homes in the Northwest, although by early 2016 the pace of appreciation largely converged across quadrants.
