WELCOME to the home page of EAGLE, the Economist Advantage in Golf Likelihood Estimator. EAGLE is a mathematical model of golf tournaments that measures every player’s chances of victory at every point in the event. When any competition that EAGLE predicts is in progress, its projected leaderboard and estimated probabilities of winning will be displayed at the top of this post. Its historical forecasts for nearly every men’s major since 2001 will appear below. You can see how the likelihood of a title evolved over the course of the event for the champion, all runners-up, the golfer we would have projected to win before play began and the golfer who attained the highest chance of victory before finishing third or lower, as well as a ranking of the worst collapses in our dataset. Between tournaments, these past predictions will move to the top of this page.
August 10th 2017: LAST summer we unveiled the inaugural edition of EAGLE (Economist Advantage in Golf Likelihood Estimator), our statistical-projection system for men’s major golf tournaments. In our summary of its methodology, we warned that the model was essentially a minimum viable product, with easily recognisable weaknesses and plenty of room for improvement. Since its release, we’ve been working hard to remedy these flaws. We are pleased to unveil EAGLE version 2.0, a far more comprehensive, robust and accurate model.
We first shared this adolescent edition of EAGLE with the public at the MIT Sloan Sports Analytics Conference this March. For unacquainted readers, we would recommend this video of our presentation, best viewed alongside the corresponding slides. A detailed summary of the original model’s methodology can be found below. But if you’re already familiar with the mechanics of EAGLE when it first emerged and are mainly interested in what’s new, please read on from here.
The whole enchilada From the moment it hatched, EAGLE suffered from malnutrition. A model is only as good as the data it is trained on, and the first incarnation of EAGLE was fed only a starvation diet of historical scores from major tournaments since 2001. Although 450,000 player-holes might sound like a lot, around five-sixths of the events in which a typical player participates are not majors. As a result, baby EAGLE based its predictions on a mere sliver of a golfer’s total oeuvre.
The model sought to compensate for this weakness by using the Official World Golf Rankings (OWGRs) as a proxy for the scores for the missing events. However, they proved to be a poor substitute for the real thing. Because the OWGRs are based on where a player finishes in a tournament’s final ranking rather than his absolute score, they unfairly punish golfers who compile outstanding performances but suffer the misfortune to participate in the same tournament as someone who fares even better, and equally unjustly reward those who manage to win a title despite a good-but-not-great showing because no one happens to bring their “A” game to a given event. This makes them essentially a backwards-looking measure with limited predictive power. Moreover, EAGLE’s reliance on them turned into an unhealthy dependency: the OWGRs always wound up constituting at least two-thirds of EAGLE’s overall estimate of a player’s skill, and usually far more than that.
EAGLE has now graduated to the modeling equivalent of solid food: it incorporates every round played by every golfer in every OWGR-recognised stroke-play event since August 2006. As a result, world rankings have become an afterthought: they now represent a mere 3% or so of a typical player’s skill prediction. The lion’s share is instead based on golfers’ individual performances, regardless of how everyone else happened to play on the same day. The model still does use the OWGRs as a measure of the strength of the field that shows up for a given event, so that it can compare scores from tournaments involving the world’s best players with those from third- and fourth-tier events on a level playing field, but that process introduces only a fraction of the error of the original approach.
Weathering the storm Every golfer knows that the same hole can play entirely differently from one day to the next based on course conditions. Rain, wind and humidity (or their absence) can turn a cakewalk into a minefield, or vice versa. EAGLE 1.0 evaluated the difficulty of each course and hole overall, but did not account for day-to-day variation. Its successor does not explicitly incorporate weather effects into its forecast with actual data on temperatures, clouds and the like. However, it does examine how players in a tournament as a group are faring relative to its expectations on each day, and adjust its overall expectations for their performance accordingly. If birdies and eagles are fluttering in the morning like a seasonal migration, that is probably an indication that the skies are clear and the greens are soft; conversely, if bogeys and worse abound among early tee groups (after accounting for those players’ expected skill level), golfers who get going later in the day can probably expect an obstacle course as well.
Everyone’s a special snowflake Another false assumption on which EAGLE 1.0 depended was that all golfers of equivalent skill should have identical forecasts for a given hole. In fact, every player is different: even after controlling for their overall performances, some are better at driving and some at putting, some more aggressive and others more conservative and so on. EAGLE 2.0 does not measure playing style directly through data like driving distance. But it does use golfers’ historical records in majors to determine whether they have tended to over- or under-perform its projections in the past on short holes or long ones, par-threes or par-fives and holes that are unusually difficult or easy. As a result, players who have tended to fare disproportionately well on long holes will receive higher win probabilities on long courses and lower ones on short courses, and vice versa.
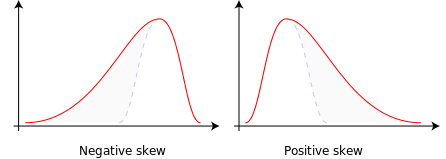
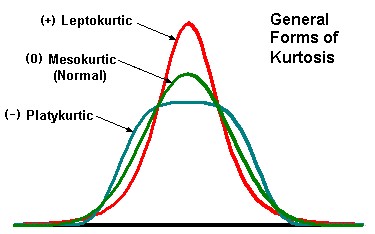
Every moment is magical Just as EAGLE 1.0 wrongly spat out identical predictions for golfers of the same skill, so too did it produce identical probabilities for each score outcome (e.g. a birdie or a bogey) for golfers with the same projected average score on a hole of a given par and yardage. In fact, probability distributions with the same mean can look vastly different: they can be spread out or bunched together, lopsided to the left or right and have broad or narrow shoulders. These distinctions apply both to players—reflecting whether they tend to play conservatively and lay up, or aggressively and go for the green—and to holes, where ones with lots of hazards will have a wider standard deviation (range of outcomes) than less perilous ones will. EAGLE 2.0 projects all four moments of the scoring distribution for players, courses and holes, and calculates its probabilities accordingly.
The full Monte (Carlo) Finally, we have revamped EAGLE’s simulation method. Although last year’s model did update its projected hole-outcome probabilities (such as birdies and bogeys) for each player in each simulation based on their previous performance, it otherwise treated every player-hole as a completely independent event. In contrast, EAGLE 2.0 first simulates an expected quality of performance for each golfer on each day in each simulation, as well as an expected difficulty of the overall course and each hole on each day. It then calculates the outcome probabilities for each player-hole based on these expected daily averages. This both ensures that the simulation process will explore the full range of permutations—e.g., a player having an off day just when a course happens to be playing unusually easily—and will properly account for any tendency players may have to carry over positive or negative momentum from one hole to the next on a given day.
I have to admit it’s getting better Following this booming growth spurt, EAGLE is no longer a mere fledgling. But it is still far from fully fledged. At the moment, it only sups upon hole scores from majors and round-level data from non-major tournaments; in the future, we hope to feed it a banquet of hole-by-hole and even shot-by-shot statistics. Similarly, EAGLE currently relies on inference to suss out big hitters from putting metronomes, hazard-ridden holes from straight shots and the like. Although its intuition is formidable, it is still a weak substitute for explicitly incorporating driving distances, weather reports and course maps. If it is a keen-eyed predator now, we hope that it will eventually mature into a bald-headed sage. We’re eager to hear constructive criticism and any suggestions for improvement, so if you have any thoughts to contribute, please do share them in the comment thread below.
Our original methodology summary, July 15th 2016: EAGLE was first developed using a dataset of some 440,000 golfer-holes drawn from major tournaments during the past 15 years. Conceptually, it is quite straightforward. First, the system estimates each player’s skill level on every hole they play. Next, it calculates the probability of a golfer of that ability producing each score type on every hole, ranging from an eagle (two strokes below par) to a quadruple bogey (four strokes above it), according to the hole’s configuration and difficulty. Finally, it uses those probabilities to simulate every hole left to play in the event 10,000 times for each golfer, counting the number of simulations won by each participant in order to derive their chances of victory.
EAGLE’s number-crunching starts with the simplest of premises: that the Official World Golf Ranking (OWGR) is a reasonable proxy for a player’s skill. The evidence supports this hypothesis. Players with worse ranks tend to have inferior scores to those with better ranks. Those who do not make the top 200 at all fare even poorer (see chart 1). However, the OWGR is a far more reliable guide to the ability of elite players, whose scores are clustered around par, than it is to that of golfers in the bottom half of the rankings, whose average results sometimes push much closer towards bogey range and sometimes don’t. Because of this phenomenon, we have nicknamed this graph the “gramophone plot”.
The next step in the analysis also stands to reason: that holes of different par values are likely to display different characteristics, and that holes where the pin sits far from the tee will be more difficult than those where it is close. The numbers bear out this assumption as well. Although absolute stroke totals are of course highest on par-fives and lowest on par-threes, par tends to be much easier to beat on par-fives than on fours and threes (see chart 2). At the same time, scores on par fives are also much more influenced by the distance to the hole than those on fours and threes are. Presumably, this is because only the top drivers in the sport can reach a far-off green fast enough to have a shot at beating par. In addition, scores on par-threes tend to cluster very close to par with a smattering of bogeys, whereas birdies and even eagles are far more common on par-fives. So a player seeking to protect a narrow lead will benefit from a course with a lot of par-threes, which prevent opponents from making up too much ground. One hoping for an unlikely comeback should hope for a steady diet of par-fives.
Together, these three factors—the OWGR, par and distance—account for a sizeable chunk of the variation in golfers’ scores. By combining them in a multiple linear regression, EAGLE can calculate a baseline forecast score for any golfer on any hole. For example, we’d expect a player ranked fifth in the world on a relatively short 500-yard (457-metre) par-five to score around 0.407 strokes below par—say, 59.3% pars and 40.7% birdies. In contrast, an unranked player on a challenging par-four of the same length would be projected for a score of 0.479 strokes above par, perhaps in the form of 52.1% pars and 47.9% bogeys.
No two holes are alike Unfortunately, this approach relies on two false, simplifying assumptions: that all holes of the same par and distance are alike, and that all golfers of the same world ranking are alike. Let’s dispel with these fictions.
Although we don’t have specific historical data about non-distance factors that contribute to a hole’s difficulty, such as bunkers and water hazards, we can infer information about them from how golfers perform as a group. The first time we see a course, we assume that each hole displays normal difficulty for its par and distance. By the second round, we can compare the average score of everyone who played it previously with the result we would have expected based on their OWGRs, and on the holes’ pars and yardages. On some holes, seemingly everyone in the field will birdie; on others even a straight par looks like a remarkable achievement.
These patterns turn out to be highly consistent within tournaments, though they are not particularly durable from year to year. Take the notorious 14th hole at Pebble Beach in California (pictured), a 580-yard par-five, which was last played in a major for the 2010 US Open. Based on the OWGRs of the golfers in that event and the hole’s par value and distance, EAGLE expected the group to average 0.145 strokes below par on number 14. But on the first day of that tournament, they actually combined for 0.435 strokes above par. That proved to be a reliable harbinger of its difficulty: the field did not come close to the model’s rank-derived forecast on any of the three subsequent days. In the second round, they averaged 0.474 shots worse than par. And even after the weaker golfers were cut at the tournament’s halfway mark, they could not do better than 0.401 above par in the third and fourth rounds.
Of course, Pebble Beach’s number 14 is famous for a reason (and it is now being modified to make it less brutal). But in one sense, it is highly typical: most holes that show such large discrepancies from EAGLE’s base forecast early in a tournament tend to sustain them in later rounds. We decided we could take advantage of this trend by measuring it using a non-linear regression, to determine just how much of the effect we can expect to persist from day to day. After calculating this factor, we add it into EAGLE’s forecast.
Next, EAGLE seeks to distinguish between golfers of equivalent OWGRs. Most importantly, not all world number ones are created equal. At the height of his powers, Tiger Woods won seven majors in three years. In contrast, Jason Day, today’s top-ranked player, has just a single major title to his name. Moreover, the OWGRs suffer from other flaws. They ignore all data over two years old. And they are based exclusively on a player’s finishes in tournaments rather than his individual scores. That means that a golfer’s rank will get worse if he has the best round of his life on a day when a few competitors happen to do a little bit better. So our next step was to conduct another non-linear regression, to determine the optimal blend of a player’s OWGR-based forecast alongside his own historical difficulty-adjusted scores in major tournaments.
Players outside the top 200 do not have a specific OWGR-based projection. As a result, we had to use the average performance of all unranked golfers in its stead. Unsurprisingly, this figure turned out to be quite a weak predictor. So unranked players, unless they have a large amount of recent major-tournament experience, tend to have very volatile projections: a few birdies in a row on the first day of a tournament are enough to increase EAGLE’s estimate of their skill level significantly. In contrast, the OWGRs are impressively reliable. Even for the most frequently observed golfer in our dataset—Mr Scott, who shot almost 4,000 holes at major PGA tournaments between 2001 and 2015—we wound up weighting the OWGRs about twice as much as his personal record.
Max Planck′s favourite sport Thanks to these corrections, EAGLE can replace its simple projection based on OWGR, par and distance with a customised forecast that incorporates each hole’s specific difficulty and each player’s past performance. However, all of these calculations still rely on a third false assumption: that golf scores come in infinitely divisible pieces. The output of the equations outlined above is a projection of a player’s expected score on a given hole—as good as 0.689 strokes below par, if you’re Rory McIlroy on an impossibly short 284-yard par-four at the 2015 US Open (he eagled it), or as bad as 1.045 strokes above it if you had the misfortune to be a slumping Charles Challen on the eighth hole of the second round of the 2003 British Open (he bogeyed). In reality, no one gets a -0.689 or a +1.045, because there are no fractional strokes. There are only eagles, birdies, pars and the ever-worsening parade of bogey types—leaving aside the astonishingly rare three-under-par albatross, which occurred just eight times in our entire dataset.
In order to translate these continuous projections into discrete scores, we used a cumulative ordered logit regression. This technique generates probabilities for seven different outcomes for each golfer on each hole, ranging from eagle to quadruple bogey. (Scores below -2 or above +4 were so rare that we could not model them reliably.) The resulting forecasts vary based on the hole’s par value and distance, how the field performed on the hole previously and the golfer’s skill. Chart 3 illustrates the range of potential outcomes. For the shortest and longest holes in our dataset of each par value, it lists the chances of each score for the best and worst golfers that played them.
Yes, 2 billion simulated holes Finally, with these probabilities in hand, we deployed the Monte Carlo simulation method, originally developed by nuclear-weapons scientists in the 1940s. For each golfer on each hole in each tournament, we pulled random numbers ranging from zero to one 10,000 times, using the previously-calculated probabilities to assign each number to an outcome like birdie or bogey. We then repeated the exercise as tournaments proceeded, simulating the remainder of the event after every golfer had completed the first hole, and again after they had completed the first and second, and so on until there was only one hole left to simulate. All told, we simulated over 2 billion golfer-holes. In each run, we allowed each player’s projected hole outcomes to be influenced by earlier ones, so that a golfer who randomly happened to draw a few double bogeys to start a tournament would see his forecasts for the rest of that simulation deteriorate accordingly. Once the CPUs finished grinding, all we had to do was tally up the results and see how often each player won.
The resulting probabilities seem fairly well-calibrated (see chart 4). There were 351,000 golfer-holes where EAGLE pegged a player’s likelihood of winning at less than 0.5%. It expected 0.1% of that group to defy the odds and win. Sure enough, precisely 0.1% did. (The most unlikely comeback was the Korean journeyman Y.E. Yang’s astonishing rally in the 2009 PGA Championship after trailing Mr Woods by eight strokes, an event so unlikely it did not occur even once among our 10,000 simulations. The next-most-improbable was Keegan Bradley’s victory at the 2011 PGA, when he fell seven strokes behind the leader in the first eight holes and wound up winning, a one-in-10,000 shot.) Similarly, players projected to win one time out of 20 did so 5% of the time, those forecast for one in ten prevailed 11% of the time and those predicted at one in five came through 20% of the time.
Because the vast majority of golfers go on to lose, there are far fewer cases when one has a strong chance of winning. As a result, the numbers at the high end are somewhat less reliable. For example, the 156 players estimated for a joint 45% probability actually won 63% of the time, and another 274 given a collective 79% forecast went on to win 86% of the time. But these are outliers: the predicted chances for most of the groups of favourites were still spot-on. And there was no apparent pattern to the errors, suggesting they are likely to be mere consequences of smaller sample sizes rather than a systematic flaw.
You may be wondering whether you can use EAGLE to make money. We wouldn’t recommend trying. Using historical betting lines from GolfOdds.com, we compared EAGLE’s past pre-tournament projections to those of leading bookmakers. Although the two generally tracked quite closely—their correlation coefficient was 0.84, where 1 means moving in perfect unison—we found both that the bookies’ lines were more accurate than ours, and that adding in a dose of EAGLE to the market predictions did not improve their forecasts. We’re not discouraged by this: given that EAGLE relies exclusively on publicly available course, scorecard and ranking data, it would be quite striking if highly competitive betting markets had not already incorporated such information fully. What EAGLE can do that Las Vegas can’t is tell you not just what will happen, but why. And it’s still possible that EAGLE’s ability to update its forecasts as an event proceeds might outpace the markets. We plan to collect data on this during future tournaments.
The best is yet to come EAGLE is a work in progress, and will improve with time. Above all, we still have not managed to rid the model of its unproven assumptions. Its Monte Carlo approach rests on the premise that each competitor’s performance is unaffected by that of any other. In reality, golfers face strategic incentives to alter their play. One nursing a healthy lead should lay up and settle for par to avoid a Spieth-like collapse, whereas one trailing by a large margin would do well to take risks. Players may also be affected psychologically by their position in the standings. Similarly, EAGLE currently assumes that all golfers of equivalent skill will perform equally on holes of equivalent difficulty. This is almost surely false. There must be some degree of “fit”, good or bad, between a golfer’s individual strengths and weaknesses and the course he is playing. Future iterations of EAGLE will attempt to incorporate these dynamics.
In addition, EAGLE now weights a player’s past performances based exclusively on how long ago they occurred. This could turn out to be an oversimplification. We’d like to explore the notion of “streakiness” or a “hot hand”, and find out whether a player who happens to put together a few remarkable or terrible rounds in a row is likely to continue those trends in the short term. And finally, there are countless additional data sources that can enrich EAGLE. We plan to test the impact of tee times and weather, to separate out putting and driving performance, to use non-scorecard information like driving distances and accuracy and to expand our dataset to include non-major tournaments. Keep checking in at economist.com/eagle.


