
Remaining Analyses Part 15
The growth data wasn’t very interesting
Well, I guess it’s interesting. But just not for my proteomics story. In this R script, I looked at differences in percent growth by site.
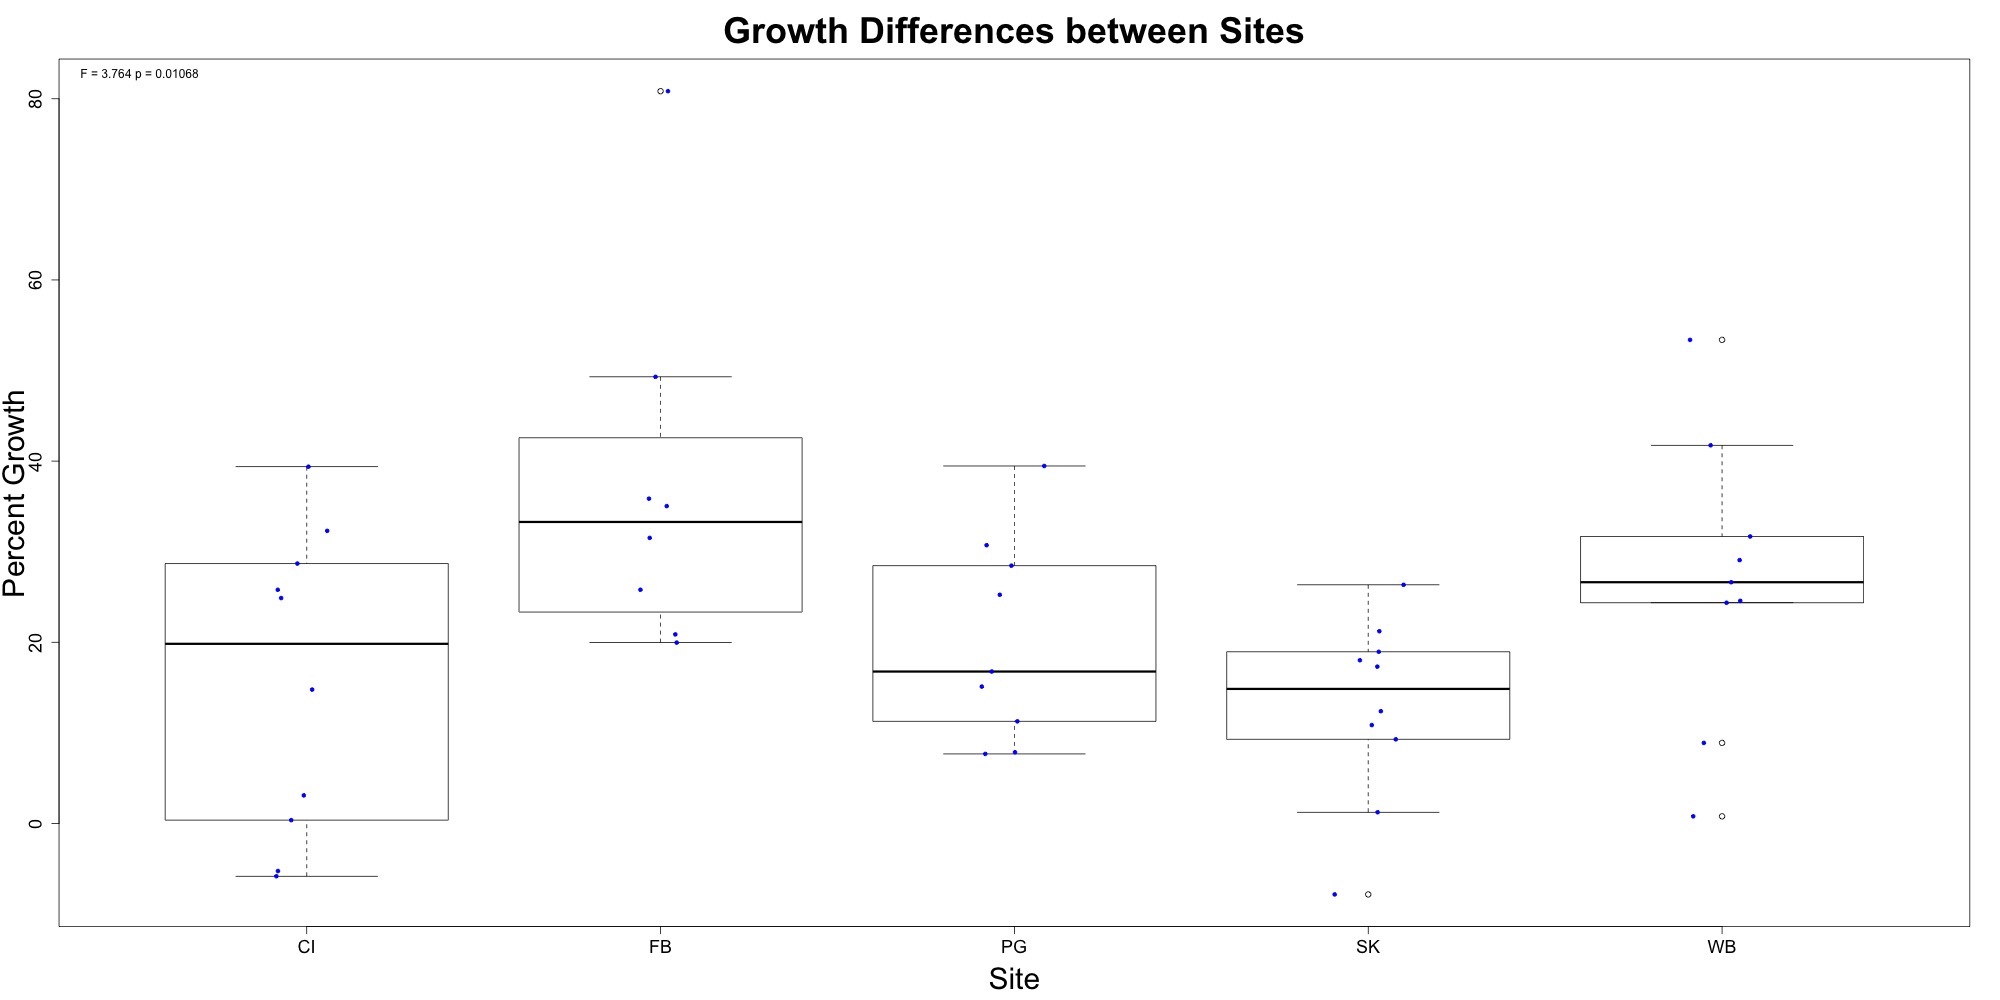
Figure 1. Differences in percent growth by site.
Willapa Bay had the least variation in percent growth for just my samples. The ANOVA was significant, but a Tukey test revealed that the only significant pairwise differences were FB-CI (p = 0.0313908) and SK-FB (p = 0.0102010).
To see if the growth data could explain any differences in peptide abundance, I regressed peptide abundance against percent growth. I generated 37 scatterplots, which can be found in this folder. None of the R-squared values were any different from zero, so I didn’t put them into a new table.
My conclusion is that the growth data isn’t going to be a part of my paper’s story. One less thing to worry about!