Today’s app stores each may host well over a million apps, but consumers only use roughly 26 or 27 of these per month, according to new data from Nielsen out today. However, the time they spend engaging with those apps is increasing – up 63 percent over the past two years, the study found.
In the fourth quarter of 2012, consumers spent 23 hours and two minutes per month engaging with apps. That climbed to 37 hours and 28 minutes in the fourth quarter of 2014.
In other words, those apps that make it into the lucky two dozen-plus per month that actually get used are likely being used fairly heavily.
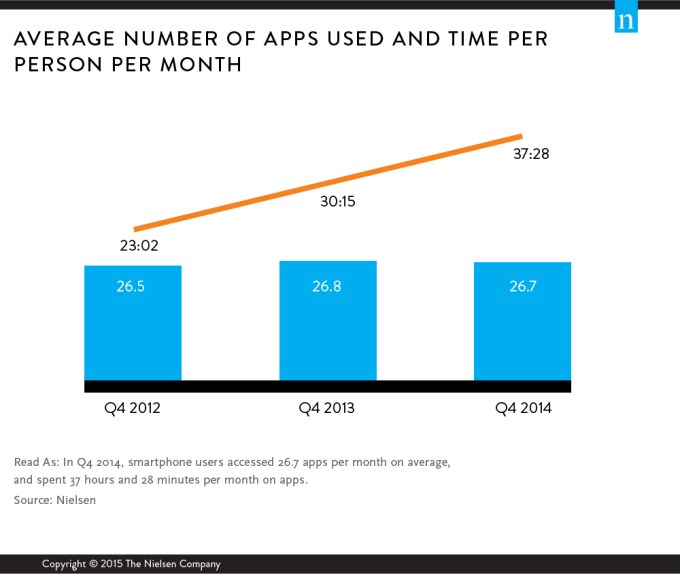
This is not the first time Nielsen has suggested there’s an upper limit to how many apps consumers can use on a monthly basis. The firm reported last summer that the number of apps seeing monthly use has only slightly increased over the years. On average, consumers used 23.3 apps per month in 2011, 26.5 apps in 2012 and 26.8 apps in 2013.
The most recent numbers for Q4 2014 are broken down by gender: men use 27.2 apps per month compared with 26.3 apps per month for women. Or, on average, consumers today use 26.7 apps per month.
The data is collected with permission from U.S. smartphone users by way of a background app on Android, and on iOS, Nielsen logs data as iOS traffic is routed through a proxy. Its panel distribution is 58 percent Android and 42 percent iOS users, and is collected from a sizable group of 5,000 panelists across various demographic groups, races and ethnicities.
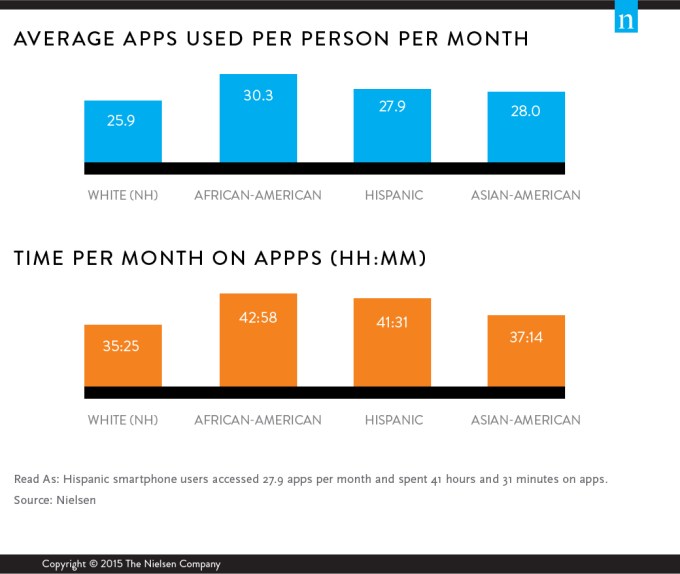
Another notable finding relates to how the different races and ethnicities engage with apps. The firm found that African-Americans use the most apps per month (30.3), but they’re also the most heavily engaged users, spending nearly 43 hours per month in apps. Hispanics, meanwhile, spend 41 hours and 31 minutes per month across 27.9 apps on average. Asian-Americans spend 27 hours and 14 minutes per month, while white non-Hispanic users spend 35 hours and 25 minutes per month in apps.
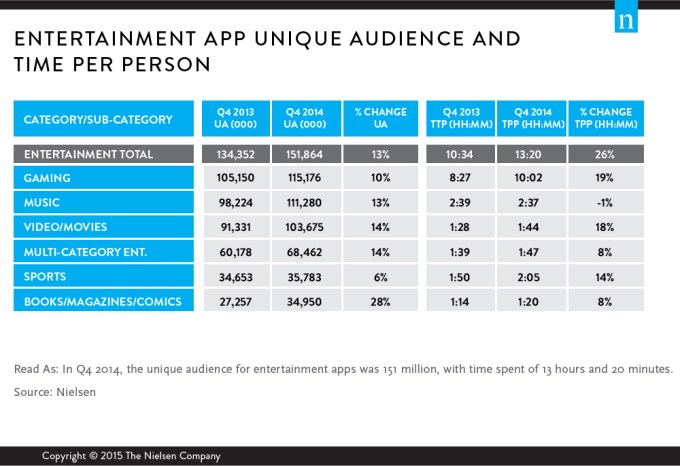
Nielsen says the “entertainment” category of apps is driving the most usage. However, it defines this group of apps rather broadly, saying that entertainment apps can be mobile games or even apps where users check the weather or sports scores.
That being said, this group of apps saw a 13 percent increase in unique audience year-over-year as of fourth-quarter 2014. And that audience is spending nearly three hours more on apps over the same period – up 26 percent from the prior year.
The gaming subcategory, unsurprisingly, saw the most usage, with 76 percent of entertainment apps users playing at least one game in Q4 2014, and time spent increasing by 1 hour 35 minutes per month to 10 hours 2 minutes. Music was the second most popular subcategory, followed by video and movies.
Yet, despite the growth of the app marketplaces themselves, which has introduced a ever-expanding selection of apps to choose from, app makers are still having to fight each other to be one of the small handful of apps that get used regularly. While some apps, like Facebook, are always in this short list, others, like games, are played then disposed of, freeing up space for a new title to snag a spot.
The disposable nature of gaming apps has also begun to spread to the wider App Store in recent months, where some titles – think Yo, or that brief MyIdol craze – are wildly popular for months, weeks or sometimes only days, before being forgotten on back screens.