Cleartrip mobile Q2'14 Infographic : How India Travels Thrugh Mobile
•
8 likes•5,329 views

Cleartrip mobile Q2'14 Infographic : How India Travels Thrugh Mobile
Recommended

Recommended
More Related Content
What's hot
What's hot (20)
Similar to Cleartrip mobile Q2'14 Infographic : How India Travels Thrugh Mobile
Similar to Cleartrip mobile Q2'14 Infographic : How India Travels Thrugh Mobile (20)
More from NextBigWhat
More from NextBigWhat (20)
Recently uploaded
Recently uploaded (20)
Cleartrip mobile Q2'14 Infographic : How India Travels Thrugh Mobile
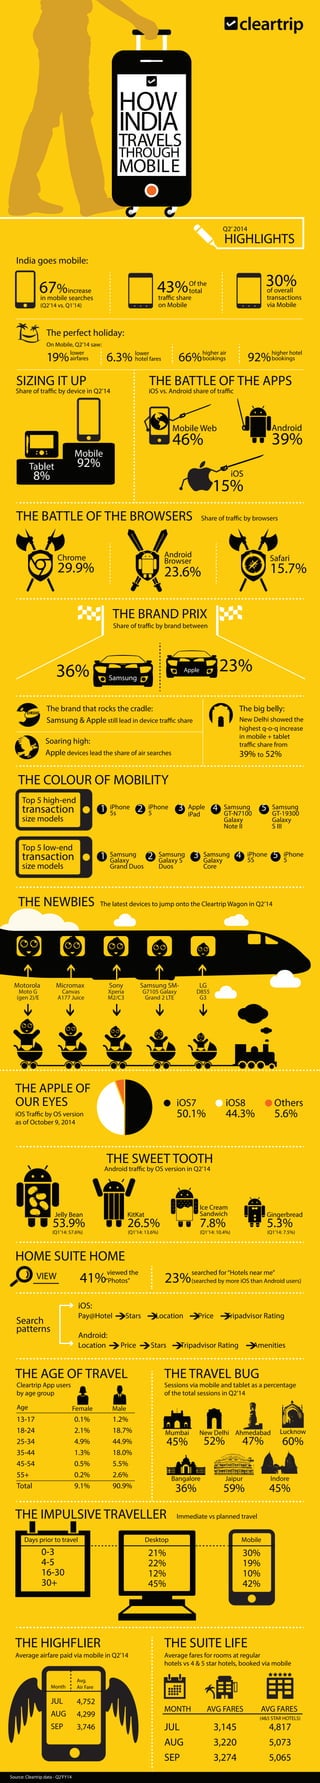
- 1. Q2’ 2014 HIGHLIGHTS India goes mobile: increase 67% in mobile searches (Q2’14 vs. Q1’14) The perfect holiday: On Mobile, Q2’14 saw: 30% 43% of overall higher air bookings lower hotel fares THE BRAND PRIX Share of trac by brand between 36% Samsung 23% Apple 19% lower airfares 6.3% 66% higher hotel 92%bookings HOW INDIA TRAVELS THROUGH MOBILE trac share on Mobile transactions via Mobile The brand that rocks the cradle: Samsung Apple still lead in device trac share Soaring high: Apple devices lead the share of air searches Top 5 high-end transaction size models 5s 2 iPhone 5 3 Apple 5S 5 iPhone 5 THE NEWBIES The latest devices to jump onto the Cleartrip Wagon in Q2’14 Motorola Moto G (gen 2)/E Micromax Canvas A177 Juice Sony Xperia M2/C3 Samsung SM-G7105 Galaxy Grand 2 LTE LG D855 G3 THE APPLE OF OUR EYES iOS Trac by OS version as of October 9, 2014 The big belly: New Delhi showed the highest q-o-q increase in mobile + tablet trac share from 39% to 52% SIZING IT UP Share of trac by device in Q2’14 THE BATTLE OF THE APPS iOS vs. Android share of trac Mobile Tablet 92% 8% Of the total Android 39% Mobile Web 46% iOS 15% THE BATTLE OF THE BROWSERS Share of trac by browsers THE COLOUR OF MOBILITY Safari 15.7% Chrome 29.9% Android Browser 23.6% THE SWEET TOOTH Android trac by OS version in Q2’14 Jelly Bean 53.9% (Q1’14: 57.6%) KitKat 26.5% (Q1’14: 13.6%) Ice Cream Sandwich 7.8% (Q1’14: 10.4%) THE AGE OF TRAVEL THE TRAVEL BUG Cleartrip App users by age group Ahmedabad 47% THE IMPULSIVE TRAVELLER Immediate vs planned travel Days prior to travel Desktop Mobile 0-3 4-5 16-30 30+ 21% 22% 12% 45% 30% 19% 10% 42% THE HIGHFLIER Average airfare paid via mobile in Q2’14 Month JUL AUG SEP Avg. Air Fare 4,752 4,299 3,746 THE SUITE LIFE Gingerbread 5.3% (Q1’14: 7.5%) Average fares for rooms at regular hotels vs 4 5 star hotels, booked via mobile MONTH JUL AUG SEP AVG FARES 3,145 3,220 3,274 AVG FARES (45 STAR HOTELS) 4,817 5,073 5,065 HOME SUITE HOME VIEW 41% viewed the “Photos” 23%searched for “Hotels near me” (searched by more iOS than Android users) Search patterns iOS: Pay@Hotel Stars Location Price Tripadvisor Rating Android: Location Price Stars Tripadvisor Rating Amenities Source: Cleartrip data - Q2’FY14 Sessions via mobile and tablet as a percentage of the total sessions in Q2’14 Age Female Male 13-17 0.1% 18-24 2.1% 25-34 4.9% 35-44 1.3% 45-54 0.5% 55+ 0.2% Total 9.1% 1.2% 18.7% 44.9% 18.0% 5.5% 2.6% 90.9% Mumbai 45% New Delhi 52% Bangalore 36% Jaipur 59% Lucknow 60% Indore 45% iOS7 50.1% iOS8 44.3% Others 5.6% 1 iPhone iPad 4 Samsung GT-N7100 Galaxy Note II 5 Samsung GT-19300 Galaxy S III Top 5 low-end transaction size models 1 Samsung Galaxy Grand Duos 2 Samsung Galaxy S Duos 3 Samsung Galaxy Core 4 iPhone