Command Reference
Table of Contents
- Image Identification
- Processes and DLLs
- Process Memory
- Kernel Memory and Objects
- Networking
- Registry
- Crash Dumps, Hibernation, and Conversion
- File System
- Miscellaneous
For a high level summary of the memory sample you're analyzing, use the imageinfo command. Most often this command is used to identify the operating system, service pack, and hardware architecture (32 or 64 bit), but it also contains other useful information such as the DTB address and time the sample was collected.
$ python vol.py -f ~/Desktop/win7_trial_64bit.raw imageinfo
Volatility Foundation Volatility Framework 2.4
Determining profile based on KDBG search...

          Suggested Profile(s) : Win7SP0x64, Win7SP1x64, Win2008R2SP0x64, Win2008R2SP1x64
                     AS Layer1 : AMD64PagedMemory (Kernel AS)
                     AS Layer2 : FileAddressSpace (/Users/Michael/Desktop/win7_trial_64bit.raw)
                      PAE type : PAE
                           DTB : 0x187000L
                          KDBG : 0xf80002803070
          Number of Processors : 1
     Image Type (Service Pack) : 0
                KPCR for CPU 0 : 0xfffff80002804d00L
             KUSER_SHARED_DATA : 0xfffff78000000000L
           Image date and time : 2012-02-22 11:29:02 UTC+0000
     Image local date and time : 2012-02-22 03:29:02 -0800
The imageinfo output tells you the suggested profile that you should pass as the parameter to --profile=PROFILE when using other plugins. There may be more than one profile suggestion if profiles are closely related. It also prints the address of the KDBG (short for _KDDEBUGGER_DATA64) structure that will be used by plugins like pslist and modules to find the process and module list heads, respectively. In some cases, especially larger memory samples, there may be multiple KDBG structures. Similarly, if there are multiple processors, you'll see the KPCR address and CPU number for each one.
Plugins automatically scan for the KPCR and KDBG values when they need them. However, you can specify the values directly for any plugin by providing --kpcr=ADDRESS or --kdbg=ADDRESS. By supplying the profile and KDBG (or failing that KPCR) to other Volatility commands, you'll get the most accurate and fastest results possible.
Note: The imageinfo plugin will not work on hibernation files unless the correct profile is given in advance. This is because important structure definitions vary between different operating systems.
As opposed to imageinfo which simply provides profile suggestions, kdbgscan is designed to positively identify the correct profile and the correct KDBG address (if there happen to be multiple). This plugin scans for the KDBGHeader signatures linked to Volatility profiles and applies sanity checks to reduce false positives. The verbosity of the output and number of sanity checks that can be performed depends on whether Volatility can find a DTB, so if you already know the correct profile (or if you have a profile suggestion from imageinfo), then make sure you use it.
Here's an example scenario of when this plugin can be useful. You have a memory sample that you believe to be Windows 2003 SP2 x64, but pslist doesn't show any processes. The pslist plugin relies on finding the process list head which is pointed to by KDBG. However, the plugin takes the first KDBG found in the memory sample, which is not always the best one. You may run into this problem if a KDBG with an invalid PsActiveProcessHead pointer is found earlier in a sample (i.e. at a lower physical offset) than the valid KDBG.
Notice below how kdbgscan picks up two KDBG structures: an invalid one (with 0 processes and 0 modules) is found first at 0xf80001172cb0 and a valid one (with 37 processes and 116 modules) is found next at 0xf80001175cf0. In order to "fix" pslist for this sample, you would simply need to supply the --kdbg=0xf80001175cf0 to the plist plugin.
$ python vol.py -f Win2K3SP2x64-6f1bedec.vmem --profile=Win2003SP2x64 kdbgscan
Volatility Foundation Volatility Framework 2.4
**************************************************
Instantiating KDBG using: Kernel AS Win2003SP2x64 (5.2.3791 64bit)
Offset (V)                    : 0xf80001172cb0
Offset (P)                    : 0x1172cb0
KDBG owner tag check          : True
Profile suggestion (KDBGHeader): Win2003SP2x64
Version64                     : 0xf80001172c70 (Major: 15, Minor: 3790)
Service Pack (CmNtCSDVersion) : 0
Build string (NtBuildLab)     : T?
PsActiveProcessHead           : 0xfffff800011947f0 (0 processes)
PsLoadedModuleList            : 0xfffff80001197ac0 (0 modules)
KernelBase                    : 0xfffff80001000000 (Matches MZ: True)
Major (OptionalHeader)        : 5
Minor (OptionalHeader)        : 2

**************************************************
Instantiating KDBG using: Kernel AS Win2003SP2x64 (5.2.3791 64bit)
Offset (V)                    : 0xf80001175cf0
Offset (P)                    : 0x1175cf0
KDBG owner tag check          : True
Profile suggestion (KDBGHeader): Win2003SP2x64
Version64                     : 0xf80001175cb0 (Major: 15, Minor: 3790)
Service Pack (CmNtCSDVersion) : 2
Build string (NtBuildLab)     : 3790.srv03_sp2_rtm.070216-1710
PsActiveProcessHead           : 0xfffff800011977f0 (37 processes)
PsLoadedModuleList            : 0xfffff8000119aae0 (116 modules)
KernelBase                    : 0xfffff80001000000 (Matches MZ: True)
Major (OptionalHeader)        : 5
Minor (OptionalHeader)        : 2
KPCR                          : 0xfffff80001177000 (CPU 0)
For more information on how KDBG structures are identified read Finding Kernel Global Variables in Windows and Identifying Memory Images
Use this command to scan for potential KPCR structures by checking for the self-referencing members as described by Finding Object Roots in Vista. On a multi-core system, each processor has its own KPCR. Therefore, you'll see details for each processor, including IDT and GDT address; current, idle, and next threads; CPU number, vendor & speed; and CR3 value.
$ python vol.py -f dang_win7_x64.raw --profile=Win7SP1x64 kpcrscan
Volatility Foundation Volatility Framework 2.4
**************************************************
Offset (V)                    : 0xf800029ead00
Offset (P)                    : 0x29ead00
KdVersionBlock                : 0x0
IDT                           : 0xfffff80000b95080
GDT                           : 0xfffff80000b95000
CurrentThread                 : 0xfffffa800cf694d0 TID 2148 (kd.exe:2964)
IdleThread                    : 0xfffff800029f8c40 TID 0 (Idle:0)
Details                       : CPU 0 (GenuineIntel @ 2128 MHz)
CR3/DTB                       : 0x1dcec000
**************************************************
Offset (V)                    : 0xf880009e7000
Offset (P)                    : 0x4d9e000
KdVersionBlock                : 0x0
IDT                           : 0xfffff880009f2540
GDT                           : 0xfffff880009f24c0
CurrentThread                 : 0xfffffa800cf694d0 TID 2148 (kd.exe:2964)
IdleThread                    : 0xfffff880009f1f40 TID 0 (Idle:0)
Details                       : CPU 1 (GenuineIntel @ 2220 MHz)
CR3/DTB                       : 0x1dcec000
If the KdVersionBlock is not null, then it may be possible to find the machine's KDBG address via the KPCR. In fact, the backup method of finding KDBG used by plugins such as pslist is to leverage kpcrscan and then call the KPCR.get_kdbg() API function.
To list the processes of a system, use the pslist command. This walks the doubly-linked list pointed to by PsActiveProcessHead and shows the offset, process name, process ID, the parent process ID, number of threads, number of handles, and date/time when the process started and exited. As of 2.1 it also shows the Session ID and if the process is a Wow64 process (it uses a 32 bit address space on a 64 bit kernel).
This plugin does not detect hidden or unlinked processes (but psscan can do that).
If you see processes with 0 threads, 0 handles, and/or a non-empty exit time, the process may not actually still be active. For more information, see The Missing Active in PsActiveProcessHead. Below, you'll notice regsvr32.exe has terminated even though its still in the "active" list.
Also note the two processes System and smss.exe will not have a Session ID, because System starts before sessions are established and smss.exe is the session manager itself.
$ python vol.py -f ~/Desktop/win7_trial_64bit.raw --profile=Win7SP0x64 pslist
Volatility Foundation Volatility Framework 2.4
Offset(V)          Name                    PID   PPID   Thds     Hnds   Sess  Wow64 Start                Exit
------------------ -------------------- ------ ------ ------ -------- ------ ------ -------------------- --------------------
0xfffffa80004b09e0 System                    4      0     78      489 ------      0 2012-02-22 19:58:20
0xfffffa8000ce97f0 smss.exe                208      4      2       29 ------      0 2012-02-22 19:58:20
0xfffffa8000c006c0 csrss.exe               296    288      9      385      0      0 2012-02-22 19:58:24
0xfffffa8000c92300 wininit.exe             332    288      3       74      0      0 2012-02-22 19:58:30
0xfffffa8000c06b30 csrss.exe               344    324      7      252      1      0 2012-02-22 19:58:30
0xfffffa8000c80b30 winlogon.exe            372    324      5      136      1      0 2012-02-22 19:58:31
0xfffffa8000c5eb30 services.exe            428    332      6      193      0      0 2012-02-22 19:58:32
0xfffffa80011c5700 lsass.exe               444    332      6      557      0      0 2012-02-22 19:58:32
0xfffffa8000ea31b0 lsm.exe                 452    332     10      133      0      0 2012-02-22 19:58:32
0xfffffa8001296b30 svchost.exe             568    428     10      352      0      0 2012-02-22 19:58:34
0xfffffa80012c3620 svchost.exe             628    428      6      247      0      0 2012-02-22 19:58:34
0xfffffa8001325950 sppsvc.exe              816    428      5      154      0      0 2012-02-22 19:58:41
0xfffffa80007b7960 svchost.exe             856    428     16      404      0      0 2012-02-22 19:58:43
0xfffffa80007bb750 svchost.exe             880    428     34     1118      0      0 2012-02-22 19:58:43
0xfffffa80007d09e0 svchost.exe             916    428     19      443      0      0 2012-02-22 19:58:43
0xfffffa8000c64840 svchost.exe             348    428     14      338      0      0 2012-02-22 20:02:07
0xfffffa8000c09630 svchost.exe             504    428     16      496      0      0 2012-02-22 20:02:07
0xfffffa8000e86690 spoolsv.exe            1076    428     12      271      0      0 2012-02-22 20:02:10
0xfffffa8000518b30 svchost.exe            1104    428     18      307      0      0 2012-02-22 20:02:10
0xfffffa800094d960 wlms.exe               1264    428      4       43      0      0 2012-02-22 20:02:11
0xfffffa8000995b30 svchost.exe            1736    428     12      200      0      0 2012-02-22 20:02:25
0xfffffa8000aa0b30 SearchIndexer.         1800    428     12      757      0      0 2012-02-22 20:02:26
0xfffffa8000aea630 taskhost.exe           1144    428      7      189      1      0 2012-02-22 20:02:41
0xfffffa8000eafb30 dwm.exe                1476    856      3       71      1      0 2012-02-22 20:02:41
0xfffffa80008f3420 explorer.exe           1652    840     21      760      1      0 2012-02-22 20:02:42
0xfffffa8000c9a630 regsvr32.exe           1180   1652      0 --------      1      0 2012-02-22 20:03:05  2012-02-22 20:03:08
0xfffffa8000a03b30 rundll32.exe           2016    568      3       67      1      0 2012-02-22 20:03:16
0xfffffa8000a4f630 svchost.exe            1432    428     12      350      0      0 2012-02-22 20:04:14
0xfffffa8000999780 iexplore.exe           1892   1652     19      688      1      1 2012-02-22 11:26:12
0xfffffa80010c9060 iexplore.exe           2820   1892     23      733      1      1 2012-02-22 11:26:15
0xfffffa8001016060 DumpIt.exe             2860   1652      2       42      1      1 2012-02-22 11:28:59
0xfffffa8000acab30 conhost.exe            2236    344      2       51      1      0 2012-02-22 11:28:59
By default, pslist shows virtual offsets for the _EPROCESS but the physical offset can be obtained with the -P switch:
$ python vol.py -f ~/Desktop/win7_trial_64bit.raw --profile=Win7SP0x64 pslist -P
Volatility Foundation Volatility Framework 2.4
Offset(P)          Name                    PID   PPID   Thds     Hnds   Sess  Wow64 Start                Exit
------------------ -------------------- ------ ------ ------ -------- ------ ------ -------------------- --------------------
0x0000000017fef9e0 System                    4      0     78      489 ------      0 2012-02-22 19:58:20
0x00000000176e97f0 smss.exe                208      4      2       29 ------      0 2012-02-22 19:58:20
0x00000000176006c0 csrss.exe               296    288      9      385      0      0 2012-02-22 19:58:24
0x0000000017692300 wininit.exe             332    288      3       74      0      0 2012-02-22 19:58:30
0x0000000017606b30 csrss.exe               344    324      7      252      1      0 2012-02-22 19:58:30
...
To view the process listing in tree form, use the pstree command. This enumerates processes using the same technique as pslist, so it will also not show hidden or unlinked processes. Child process are indicated using indention and periods.
$ python vol.py -f ~/Desktop/win7_trial_64bit.raw --profile=Win7SP0x64 pstree
Volatility Foundation Volatility Framework 2.4
Name                                                  Pid   PPid   Thds   Hnds Time
-------------------------------------------------- ------ ------ ------ ------ --------------------
 0xfffffa80004b09e0:System                              4      0     78    489 2012-02-22 19:58:20
. 0xfffffa8000ce97f0:smss.exe                         208      4      2     29 2012-02-22 19:58:20
 0xfffffa8000c006c0:csrss.exe                         296    288      9    385 2012-02-22 19:58:24
 0xfffffa8000c92300:wininit.exe                       332    288      3     74 2012-02-22 19:58:30
. 0xfffffa8000c5eb30:services.exe                     428    332      6    193 2012-02-22 19:58:32
.. 0xfffffa8000aa0b30:SearchIndexer.                 1800    428     12    757 2012-02-22 20:02:26
.. 0xfffffa80007d09e0:svchost.exe                     916    428     19    443 2012-02-22 19:58:43
.. 0xfffffa8000a4f630:svchost.exe                    1432    428     12    350 2012-02-22 20:04:14
.. 0xfffffa800094d960:wlms.exe                       1264    428      4     43 2012-02-22 20:02:11
.. 0xfffffa8001325950:sppsvc.exe                      816    428      5    154 2012-02-22 19:58:41
.. 0xfffffa8000e86690:spoolsv.exe                    1076    428     12    271 2012-02-22 20:02:10
.. 0xfffffa8001296b30:svchost.exe                     568    428     10    352 2012-02-22 19:58:34
... 0xfffffa8000a03b30:rundll32.exe                  2016    568      3     67 2012-02-22 20:03:16
...
To enumerate processes using pool tag scanning (_POOL_HEADER), use the psscan command. This can find processes that previously terminated (inactive) and processes that have been hidden or unlinked by a rootkit. The downside is that rootkits can still hide by overwriting the pool tag values (though not commonly seen in the wild).
$ python vol.py --profile=Win7SP0x86 -f win7.dmp psscan
Volatility Foundation Volatility Framework 2.0
 Offset     Name             PID    PPID   PDB        Time created             Time exited
---------- ---------------- ------ ------ ---------- ------------------------ ------------------------
0x3e025ba8 svchost.exe        1116    508 0x3ecf1220 2010-06-16 15:25:25
0x3e04f070 svchost.exe        1152    508 0x3ecf1340 2010-06-16 15:27:40
0x3e144c08 dwm.exe            1540    832 0x3ecf12e0 2010-06-16 15:26:58
0x3e145c18 TPAutoConnSvc.     1900    508 0x3ecf1360 2010-06-16 15:25:41
0x3e3393f8 lsass.exe           516    392 0x3ecf10e0 2010-06-16 15:25:18
0x3e35b8f8 svchost.exe         628    508 0x3ecf1120 2010-06-16 15:25:19
0x3e383770 svchost.exe         832    508 0x3ecf11a0 2010-06-16 15:25:20
0x3e3949d0 svchost.exe         740    508 0x3ecf1160 2010-06-16 15:25:20
0x3e3a5100 svchost.exe         872    508 0x3ecf11c0 2010-06-16 15:25:20
0x3e3f64e8 svchost.exe         992    508 0x3ecf1200 2010-06-16 15:25:24
0x3e45a530 wininit.exe         392    316 0x3ecf10a0 2010-06-16 15:25:15
0x3e45d928 svchost.exe        1304    508 0x3ecf1260 2010-06-16 15:25:28
0x3e45f530 csrss.exe           400    384 0x3ecf1040 2010-06-16 15:25:15
0x3e4d89c8 vmtoolsd.exe       1436    508 0x3ecf1280 2010-06-16 15:25:30
0x3e4db030 spoolsv.exe        1268    508 0x3ecf1240 2010-06-16 15:25:28
0x3e50b318 services.exe        508    392 0x3ecf1080 2010-06-16 15:25:18
0x3e7f3d40 csrss.exe           352    316 0x3ecf1060 2010-06-16 15:25:12
0x3e7f5bc0 winlogon.exe        464    384 0x3ecf10c0 2010-06-16 15:25:18
0x3eac6030 SearchProtocol     2448   1168 0x3ecf15c0 2010-06-16 23:30:52      2010-06-16 23:33:14
0x3eb10030 SearchFilterHo     1812   1168 0x3ecf1480 2010-06-16 23:31:02      2010-06-16 23:33:14
[snip]
If a process has previously terminated, the Time exited field will show the exit time. If you want to investigate a hidden process (such as displaying its DLLs), then you'll need physical offset of the _EPROCESS object, which is shown in the far left column. Almost all process-related plugins take a --OFFSET parameter so that you can work with hidden processes.
This plugin is similar to psscan, except it enumerates processes by scanning for DISPATCHER_HEADER instead of pool tags. This gives you an alternate way to carve _EPROCESS objects in the event an attacker tried to hide by altering pool tags. This plugin is not well maintained and only supports XP x86. To use it, you must type --plugins=contrib/plugins on command-line.
To display a process's loaded DLLs, use the dlllist command. It walks the doubly-linked list of _LDR_DATA_TABLE_ENTRY structures which is pointed to by the PEB's InLoadOrderModuleList. DLLs are automatically added to this list when a process calls LoadLibrary (or some derivative such as LdrLoadDll) and they aren't removed until FreeLibrary is called and the reference count reaches zero. The load count column tells you if a DLL was statically loaded (i.e. as a result of being in the exe or another DLL's import table) or dynamically loaded.
$ python vol.py -f ~/Desktop/win7_trial_64bit.raw --profile=Win7SP0x64 dlllist
************************************************************************
wininit.exe pid:    332
Command line : wininit.exe

Base                             Size          LoadCount Path
------------------ ------------------ ------------------ ----
0x00000000ff530000            0x23000             0xffff C:\Windows\system32\wininit.exe
0x0000000076d40000           0x1ab000             0xffff C:\Windows\SYSTEM32\ntdll.dll
0x0000000076b20000           0x11f000             0xffff C:\Windows\system32\kernel32.dll
0x000007fefcd50000            0x6b000             0xffff C:\Windows\system32\KERNELBASE.dll
0x0000000076c40000            0xfa000             0xffff C:\Windows\system32\USER32.dll
0x000007fefd7c0000            0x67000             0xffff C:\Windows\system32\GDI32.dll
0x000007fefe190000             0xe000             0xffff C:\Windows\system32\LPK.dll
0x000007fefef80000            0xca000             0xffff C:\Windows\system32\USP10.dll
0x000007fefd860000            0x9f000             0xffff C:\Windows\system32\msvcrt.dll
[snip]
To display the DLLs for a specific process instead of all processes, use the -p or --pid filter as shown below. Also, in the following output, notice we're analyzing a Wow64 process. Wow64 processes have a limited list of DLLs in the PEB lists, but that doesn't mean they're the only DLLs loaded in the process address space. Thus Volatility will remind you to use the ldrmodules instead for these processes.
$ python vol.py -f ~/Desktop/win7_trial_64bit.raw --profile=Win7SP0x64 dlllist -p 1892
Volatility Foundation Volatility Framework 2.4
************************************************************************
iexplore.exe pid:   1892
Command line : "C:\Program Files (x86)\Internet Explorer\iexplore.exe"
Note: use ldrmodules for listing DLLs in Wow64 processes

Base                             Size          LoadCount Path
------------------ ------------------ ------------------ ----
0x0000000000080000            0xa6000             0xffff C:\Program Files (x86)\Internet Explorer\iexplore.exe
0x0000000076d40000           0x1ab000             0xffff C:\Windows\SYSTEM32\ntdll.dll
0x00000000748d0000            0x3f000                0x3 C:\Windows\SYSTEM32\wow64.dll
0x0000000074870000            0x5c000                0x1 C:\Windows\SYSTEM32\wow64win.dll
0x0000000074940000             0x8000                0x1 C:\Windows\SYSTEM32\wow64cpu.dll
To display the DLLs for a process that is hidden or unlinked by a rootkit, first use the psscan to get the physical offset of the EPROCESS object and supply it with --offset=OFFSET. The plugin will "bounce back" and determine the virtual address of the EPROCESS and then acquire an address space in order to access the PEB.
$ python vol.py -f ~/Desktop/win7_trial_64bit.raw --profile=Win7SP0x64 dlllist --offset=0x04a291a8
To extract a DLL from a process's memory space and dump it to disk for analysis, use the dlldump command. The syntax is nearly the same as what we've shown for dlllist above. You can:
- Dump all DLLs from all processes
- Dump all DLLs from a specific process (with
--pid=PID) - Dump all DLLs from a hidden/unlinked process (with
--offset=OFFSET) - Dump a PE from anywhere in process memory (with
--base=BASEADDR), this option is useful for extracting hidden DLLs - Dump one or more DLLs that match a regular expression (
--regex=REGEX), case sensitive or not (--ignore-case)
To specify an output directory, use --dump-dir=DIR or -d DIR.
$ python vol.py -f ~/Desktop/win7_trial_64bit.raw --profile=Win7SP0x64 dlldump -D dlls/
...
Process(V)         Name                 Module Base        Module Name          Result
------------------ -------------------- ------------------ -------------------- ------
0xfffffa8000ce97f0 smss.exe             0x0000000047a90000 smss.exe             OK: module.208.176e97f0.47a90000.dll
0xfffffa8000ce97f0 smss.exe             0x0000000076d40000                      Error: DllBase is paged
0xfffffa8000c006c0 csrss.exe            0x0000000049700000 csrss.exe            OK: module.296.176006c0.49700000.dll
0xfffffa8000c006c0 csrss.exe            0x0000000076d40000 ntdll.dll            Error: DllBase is paged
0xfffffa8000c006c0 csrss.exe            0x000007fefd860000 msvcrt.dll           Error: DllBase is paged
0xfffffa80011c5700 lsass.exe            0x000007fefcc40000 WINSTA.dll           Error: DllBase is paged
0xfffffa80011c5700 lsass.exe            0x000007fefd7c0000 GDI32.dll            OK: module.444.173c5700.7fefd7c0000.dll
0xfffffa80011c5700 lsass.exe            0x000007fefc270000 DNSAPI.dll           OK: module.444.173c5700.7fefc270000.dll
0xfffffa80011c5700 lsass.exe            0x000007fefc5d0000 Secur32.dll          OK: module.444.173c5700.7fefc5d0000.dll
...
If the extraction fails, as it did for a few DLLs above, it probably means that some of the memory pages in that DLL were not memory resident (due to paging). In particular, this is a problem if the first page containing the PE header and thus the PE section mappings is not available. In these cases you can still extract the memory segment using the vaddump command, but you'll need to manually rebuild the PE header and fixup the sections (if you plan on analyzing in IDA Pro) as described in Recovering CoreFlood Binaries with Volatility.
To dump a PE file that doesn't exist in the DLLs list (for example, due to code injection or malicious unlinking), just specify the base address of the PE in process memory:
$ python vol.py --profile=Win7SP0x86 -f win7.dmp dlldump --pid=492 -D out --base=0x00680000
You can also specify an EPROCESS offset if the DLL you want is in a hidden process:
$ python vol.py --profile=Win7SP0x86 -f win7.dmp dlldump -o 0x3e3f64e8 -D out --base=0x00680000
To display the open handles in a process, use the handles command. This applies to files, registry keys, mutexes, named pipes, events, window stations, desktops, threads, and all other types of securable executive objects. As of 2.1, the output includes handle value and granted access for each object.
$ python vol.py -f ~/Desktop/win7_trial_64bit.raw --profile=Win7SP0x64 handles
Volatility Foundation Volatility Framework 2.4
Offset(V)             Pid             Handle             Access Type             Details
------------------ ------ ------------------ ------------------ ---------------- -------
0xfffffa80004b09e0      4                0x4           0x1fffff Process          System(4)
0xfffff8a0000821a0      4               0x10            0x2001f Key              MACHINE\SYSTEM\CONTROLSET001\CONTROL\PRODUCTOPTIONS
0xfffff8a00007e040      4               0x14            0xf003f Key              MACHINE\SYSTEM\CONTROLSET001\CONTROL\SESSION MANAGER\MEMORY MANAGEMENT\PREFETCHPARAMETERS
0xfffff8a000081fa0      4               0x18            0x2001f Key              MACHINE\SYSTEM\SETUP
0xfffffa8000546990      4               0x1c           0x1f0001 ALPC Port        PowerMonitorPort
0xfffffa800054d070      4               0x20           0x1f0001 ALPC Port        PowerPort
0xfffff8a0000676a0      4               0x24            0x20019 Key              MACHINE\HARDWARE\DESCRIPTION\SYSTEM\MULTIFUNCTIONADAPTER
0xfffffa8000625460      4               0x28           0x1fffff Thread           TID 160 PID 4
0xfffff8a00007f400      4               0x2c            0xf003f Key              MACHINE\SYSTEM\CONTROLSET001
0xfffff8a00007f200      4               0x30            0xf003f Key              MACHINE\SYSTEM\CONTROLSET001\ENUM
0xfffff8a000080d10      4               0x34            0xf003f Key              MACHINE\SYSTEM\CONTROLSET001\CONTROL\CLASS
0xfffff8a00007f500      4               0x38            0xf003f Key              MACHINE\SYSTEM\CONTROLSET001\SERVICES
0xfffff8a0001cd990      4               0x3c                0xe Token
0xfffff8a00007bfa0      4               0x40            0x20019 Key              MACHINE\SYSTEM\CONTROLSET001\CONTROL\WMI\SECURITY
0xfffffa8000cd52b0      4               0x44           0x120116 File             \Device\Mup
0xfffffa8000ce97f0      4               0x48               0x2a Process          smss.exe(208)
0xfffffa8000df16f0      4               0x4c           0x120089 File             \Device\HarddiskVolume2\Windows\System32\en-US\win32k.sys.mui
0xfffffa8000de37f0      4               0x50           0x12019f File             \Device\clfsTxfLog
0xfffff8a000952fa0      4               0x54            0x2001f Key              MACHINE\SYSTEM\CONTROLSET001\CONTROL\VIDEO\{6A8FC9DC-A76B-47FC-A703-17800182E1CE}\0000\VOLATILESETTINGS
0xfffffa800078da20      4               0x58           0x12019f File             \Device\Tcp
0xfffff8a002e17610      4               0x5c                0x9 Key              MACHINE\SOFTWARE\MICROSOFT\WINDOWS NT\CURRENTVERSION\IMAGE FILE EXECUTION OPTIONS
0xfffff8a0008f7b00      4               0x60               0x10 Key              MACHINE\SYSTEM\CONTROLSET001\CONTROL\LSA
0xfffffa8000da2870      4               0x64           0x100001 File             \Device\KsecDD
0xfffffa8000da3040      4               0x68                0x0 Thread           TID 228 PID 4
...
You can display handles for a particular process by specifying --pid=PID or the physical offset of an _EPROCESS structure (--physical-offset=OFFSET). You can also filter by object type using -t or --object-type=OBJECTTYPE. For example to only display handles to process objects for pid 600, do the following:
$ python vol.py -f ~/Desktop/win7_trial_64bit.raw --profile=Win7SP0x64 handles -p 296 -t Process
Volatility Foundation Volatility Framework 2.4
Offset(V)             Pid             Handle             Access Type             Details
------------------ ------ ------------------ ------------------ ---------------- -------
0xfffffa8000c92300    296               0x54           0x1fffff Process          wininit.exe(332)
0xfffffa8000c5eb30    296               0xc4           0x1fffff Process          services.exe(428)
0xfffffa80011c5700    296               0xd4           0x1fffff Process          lsass.exe(444)
0xfffffa8000ea31b0    296               0xe4           0x1fffff Process          lsm.exe(452)
0xfffffa8000c64840    296              0x140           0x1fffff Process          svchost.exe(348)
0xfffffa8001296b30    296              0x150           0x1fffff Process          svchost.exe(568)
0xfffffa80012c3620    296              0x18c           0x1fffff Process          svchost.exe(628)
0xfffffa8001325950    296              0x1dc           0x1fffff Process          sppsvc.exe(816)
...
The object type can be any of the names printed by the "object \ObjectTypes" windbg command (see Enumerate Object Types for more details.
In some cases, the Details column will be blank (for example, if the objects don't have names). By default, you'll see both named and un-named objects. However, if you want to hide the less meaningful results and only show named objects, use the --silent parameter to this plugin.
To view the SIDs (Security Identifiers) associated with a process, use the getsids command. Among other things, this can help you identify processes which have maliciously escalated privileges and which processes belong to specific users.
For more information, see BDG's Linking Processes To Users.
$ python vol.py -f ~/Desktop/win7_trial_64bit.raw --profile=Win7SP0x64 getsids
Volatility Foundation Volatility Framework 2.4
System (4): S-1-5-18 (Local System)
System (4): S-1-5-32-544 (Administrators)
System (4): S-1-1-0 (Everyone)
System (4): S-1-5-11 (Authenticated Users)
System (4): S-1-16-16384 (System Mandatory Level)
smss.exe (208): S-1-5-18 (Local System)
smss.exe (208): S-1-5-32-544 (Administrators)
smss.exe (208): S-1-1-0 (Everyone)
smss.exe (208): S-1-5-11 (Authenticated Users)
smss.exe (208): S-1-16-16384 (System Mandatory Level)
[snip]
The cmdscan plugin searches the memory of csrss.exe on XP/2003/Vista/2008 and conhost.exe on Windows 7 for commands that attackers entered through a console shell (cmd.exe). This is one of the most powerful commands you can use to gain visibility into an attackers actions on a victim system, whether they opened cmd.exe through an RDP session or proxied input/output to a command shell from a networked backdoor.
This plugin finds structures known as COMMAND_HISTORY by looking for a known constant value (MaxHistory) and then applying sanity checks. It is important to note that the MaxHistory value can be changed by right clicking in the top left of a cmd.exe window and going to Properties. The value can also be changed for all consoles opened by a given user by modifying the registry key HKCU\Console\HistoryBufferSize. The default is 50 on Windows systems, meaning the most recent 50 commands are saved. You can tweak it if needed by using the --max_history=NUMBER parameter.
The structures used by this plugin are not public (i.e. Microsoft does not produce PDBs for them), thus they're not available in WinDBG or any other forensic framework. They were reverse engineered by Michael Ligh from the conhost.exe and winsrv.dll binaries.
In addition to the commands entered into a shell, this plugin shows:
- The name of the console host process (csrss.exe or conhost.exe)
- The name of the application using the console (whatever process is using cmd.exe)
- The location of the command history buffers, including the current buffer count, last added command, and last displayed command
- The application process handle
Due to the scanning technique this plugin uses, it has the capability to find commands from both active and closed consoles.
$ python vol.py -f VistaSP2x64.vmem --profile=VistaSP2x64 cmdscan
Volatility Foundation Volatility Framework 2.4

**************************************************
CommandProcess: csrss.exe Pid: 528
CommandHistory: 0x135ec00 Application: cmd.exe Flags: Allocated, Reset
CommandCount: 18 LastAdded: 17 LastDisplayed: 17
FirstCommand: 0 CommandCountMax: 50
ProcessHandle: 0x330
Cmd #0 @ 0x135ef10: cd \
Cmd #1 @ 0x135ef50: cd de
Cmd #2 @ 0x135ef70: cd PerfLogs
Cmd #3 @ 0x135ef90: cd ..
Cmd #4 @ 0x5c78b90: cd "Program Files"
Cmd #5 @ 0x135fae0: cd "Debugging Tools for Windows (x64)"
Cmd #6 @ 0x135efb0: livekd -w
Cmd #7 @ 0x135f010: windbg
Cmd #8 @ 0x135efd0: cd \
Cmd #9 @ 0x135fd20: rundll32 c:\apphelp.dll,ExportFunc
Cmd #10 @ 0x5c8bdb0: rundll32 c:\windows_apphelp.dll,ExportFunc
Cmd #11 @ 0x5c8be10: rundll32 c:\windows_apphelp.dll
Cmd #12 @ 0x135ee30: rundll32 c:\windows_apphelp.dll,Test
Cmd #13 @ 0x135fd70: cd "Program Files"
Cmd #14 @ 0x5c8b9e0: dir
Cmd #15 @ 0x5c8be60: cd "Debugging Tools for Windows (x64)"
Cmd #16 @ 0x5c8ba00: dir
Cmd #17 @ 0x135eff0: livekd -w

[snip]
For background information, see Richard Stevens and Eoghan Casey's Extracting Windows Cmd Line Details from Physical Memory.
Similar to cmdscan the consoles plugin finds commands that attackers typed into cmd.exe or executed via backdoors. However, instead of scanning for COMMAND_HISTORY, this plugin scans for CONSOLE_INFORMATION. The major advantage to this plugin is it not only prints the commands attackers typed, but it collects the entire screen buffer (input and output). For instance, instead of just seeing "dir", you'll see exactly what the attacker saw, including all files and directories listed by the "dir" command.
Additionally, this plugin prints the following:
- The original console window title and current console window title
- The name and pid of attached processes (walks a LIST_ENTRY to enumerate all of them if more than one)
- Any aliases associated with the commands executed. For example, attackers can register an alias such that typing "hello" actually executes "cd system"
- The screen coordinates of the cmd.exe console
Here's an example of the consoles command. Below, you'll notice something quite funny. The forensic investigator seems to have lost his mind and cannot find the dd.exe tool for dumping memory. Nearly 20 typos later, he finds the tool and uses it.
$ python vol.py -f xp-laptop-2005-07-04-1430.img consoles
Volatility Foundation Volatility Framework 2.4

[csrss.exe @ 0x821c11a8 pid 456 console @ 0x4e23b0]
  OriginalTitle: '%SystemRoot%\\system32\\cmd.exe'
  Title: 'C:\\WINDOWS\\system32\\cmd.exe - dd if=\\\\.\\PhysicalMemory of=c:\\xp-2005-07-04-1430.img conv=noerror'
  HistoryBufferCount: 2
  HistoryBufferMax: 4
  CommandHistorySize: 50
[history @ 0x4e4008]
  CommandCount: 0
  CommandCountMax: 50
  Application: 'dd.exe'
[history @ 0x4e4d88]
  CommandCount: 20
  CommandCountMax: 50
  Application: 'cmd.exe'
  Cmd #0 @ 0x4e1f90: 'dd'
  Cmd #1 @ 0x4e2cb8: 'cd\\'
  Cmd #2 @ 0x4e2d18: 'dr'
  Cmd #3 @ 0x4e2d28: 'ee:'
  Cmd #4 @ 0x4e2d38: 'e;'
  Cmd #5 @ 0x4e2d48: 'e:'
  Cmd #6 @ 0x4e2d58: 'dr'
  Cmd #7 @ 0x4e2d68: 'd;'
  Cmd #8 @ 0x4e2d78: 'd:'
  Cmd #9 @ 0x4e2d88: 'dr'
  Cmd #10 @ 0x4e2d98: 'ls'
  Cmd #11 @ 0x4e2da8: 'cd Docu'
  Cmd #12 @ 0x4e2dc0: 'cd Documents and'
  Cmd #13 @ 0x4e2e58: 'dr'
  Cmd #14 @ 0x4e2e68: 'd:'
  Cmd #15 @ 0x4e2e78: 'cd dd\\'
  Cmd #16 @ 0x4e2e90: 'cd UnicodeRelease'
  Cmd #17 @ 0x4e2ec0: 'dr'
  Cmd #18 @ 0x4e2ed0: 'dd '
  Cmd #19 @ 0x4e4100: 'dd if=\\\\.\\PhysicalMemory of=c:\\xp-2005-07-04-1430.img conv=noerror'
[screen @ 0x4e2460 X:80 Y:300]
  Output: Microsoft Windows XP [Version 5.1.2600]
  Output: (C) Copyright 1985-2001 Microsoft Corp.
  Output:
  Output: C:\Documents and Settings\Sarah>dd
  Output: 'dd' is not recognized as an internal or external command,
  Output: operable program or batch file.
  Output:
  Output: C:\Documents and Settings\Sarah>cd\
  Output:
  Output: C:\>dr
  Output: 'dr' is not recognized as an internal or external command,
  Output: operable program or batch file.
  Output:
  Output: C:\>ee:
  Output: 'ee:' is not recognized as an internal or external command,
  Output: operable program or batch file.
  Output:
  Output: C:\>e;
  Output: 'e' is not recognized as an internal or external command,
  Output: operable program or batch file.
  Output:
  Output: C:\>e:
  Output: The system cannot find the drive specified.
  Output:
  Output: C:\>dr
  Output: 'dr' is not recognized as an internal or external command,
  Output: operable program or batch file.
  Output:
  Output: C:\>d;
  Output: 'd' is not recognized as an internal or external command,
  Output: operable program or batch file.
  Output:
  Output: C:\>d:
  Output:
  Output: D:\>dr
  Output: 'dr' is not recognized as an internal or external command,
  Output: operable program or batch file.
  Output:
  Output: D:\>dr
  Output: 'dr' is not recognized as an internal or external command,
  Output: operable program or batch file.
  Output:
  Output: D:\>ls
  Output: 'ls' is not recognized as an internal or external command,
  Output: operable program or batch file.
  Output:
  Output: D:\>cd Docu
  Output: The system cannot find the path specified.
  Output:
  Output: D:\>cd Documents and
  Output: The system cannot find the path specified.
  Output:
  Output: D:\>dr
  Output: 'dr' is not recognized as an internal or external command,
  Output: operable program or batch file.
  Output:
  Output: D:\>d:
  Output:
  Output: D:\>cd dd\
  Output:
  Output: D:\dd>
  Output: D:\dd>cd UnicodeRelease
  Output:
  Output: D:\dd\UnicodeRelease>dr
  Output: 'dr' is not recognized as an internal or external command,
  Output: operable program or batch file.
  Output:
  Output: D:\dd\UnicodeRelease>dd
  Output:
  Output: 0+0 records in
  Output: 0+0 records out
  Output: ^C
  Output: D:\dd\UnicodeRelease>dd if=\\.\PhysicalMemory of=c:\xp-2005-07-04-1430.img conv=
  Output: noerror
  Output: Forensic Acquisition Utilities, 1, 0, 0, 1035
  Output: dd, 3, 16, 2, 1035
  Output: Copyright (C) 2002-2004 George M. Garner Jr.
  Output:
  Output: Command Line: dd if=\\.\PhysicalMemory of=c:\xp-2005-07-04-1430.img conv=noerror
  Output:
  Output: Based on original version developed by Paul Rubin, David MacKenzie, and Stuart K
  Output: emp
  Output: Microsoft Windows: Version 5.1 (Build 2600.Professional Service Pack 2)
  Output:
  Output: 04/07/2005  18:30:32 (UTC)
  Output: 04/07/2005  14:30:32 (local time)
  Output:
  Output: Current User: SPLATITUDE\Sarah
  Output:
  Output: Total physical memory reported: 523676 KB
  Output: Copying physical memory...
  Output: Physical memory in the range 0x00004000-0x00004000 could not be read.
This plugin shows you which process privileges are present, enabled, and/or enabled by default. You can pass it the --silent flag to only show privileges that a process explicitly enabled (i.e. that were were not enabled by default but are currently enabled). The --regex=REGEX parameter can be used to filter for specific privilege names.
$ python vol.py -f win7_trial_64bit.raw privs --profile=Win7SP0x64
Volatility Foundation Volatility Framework 2.3_alpha
Pid      Process          Value  Privilege                            Attributes               Description
-------- ---------------- ------ ------------------------------------ ------------------------ -----------
       4 System                2 SeCreateTokenPrivilege               Present                  Create a token object
       4 System                3 SeAssignPrimaryTokenPrivilege        Present                  Replace a process-level token
       4 System                4 SeLockMemoryPrivilege                Present,Enabled,Default  Lock pages in memory
       4 System                5 SeIncreaseQuotaPrivilege             Present                  Increase quotas
       4 System                6 SeMachineAccountPrivilege                                     Add workstations to the domain
       4 System                7 SeTcbPrivilege                       Present,Enabled,Default  Act as part of the operating system
       4 System                8 SeSecurityPrivilege                  Present                  Manage auditing and security log
       4 System                9 SeTakeOwnershipPrivilege             Present                  Take ownership of files/objects
       4 System               10 SeLoadDriverPrivilege                Present                  Load and unload device drivers
       4 System               11 SeSystemProfilePrivilege             Present,Enabled,Default  Profile system performance
       4 System               12 SeSystemtimePrivilege                Present                  Change the system time
       4 System               13 SeProfileSingleProcessPrivilege      Present,Enabled,Default  Profile a single process
       4 System               14 SeIncreaseBasePriorityPrivilege      Present,Enabled,Default  Increase scheduling priority
       4 System               15 SeCreatePagefilePrivilege            Present,Enabled,Default  Create a pagefile
       4 System               16 SeCreatePermanentPrivilege           Present,Enabled,Default  Create permanent shared objects
.....
To display a process's environment variables, use the envars plugin. Typically this will show the number of CPUs installed and the hardware architecture (though the kdbgscan output is a much more reliable source), the process's current directory, temporary directory, session name, computer name, user name, and various other interesting artifacts.
$ python vol.py -f ~/Desktop/win7_trial_64bit.raw --profile=Win7SP0x64 envars
Volatility Foundation Volatility Framework 2.4
Pid      Process              Block              Variable                       Value
-------- -------------------- ------------------ ------------------------------ -----
     296 csrss.exe            0x00000000003d1320 ComSpec                        C:\Windows\system32\cmd.exe
     296 csrss.exe            0x00000000003d1320 FP_NO_HOST_CHECK               NO
     296 csrss.exe            0x00000000003d1320 NUMBER_OF_PROCESSORS           1
     296 csrss.exe            0x00000000003d1320 OS                             Windows_NT
     296 csrss.exe            0x00000000003d1320 Path                           C:\Windows\system32;C:\Windows;C:\Windows\System32\Wbem;C:\Windows\System32\WindowsPowerShell\v1.0\
     296 csrss.exe            0x00000000003d1320 PATHEXT                        .COM;.EXE;.BAT;.CMD;.VBS;.VBE;.JS;.JSE;.WSF;.WSH;.MSC
     296 csrss.exe            0x00000000003d1320 PROCESSOR_ARCHITECTURE         AMD64
     296 csrss.exe            0x00000000003d1320 PROCESSOR_IDENTIFIER           Intel64 Family 6 Model 2 Stepping 3, GenuineIntel
     296 csrss.exe            0x00000000003d1320 PROCESSOR_LEVEL                6
     296 csrss.exe            0x00000000003d1320 PROCESSOR_REVISION             0203
     296 csrss.exe            0x00000000003d1320 PSModulePath                   C:\Windows\system32\WindowsPowerShell\v1.0\Modules\
     296 csrss.exe            0x00000000003d1320 SystemDrive                    C:
     296 csrss.exe            0x00000000003d1320 SystemRoot                     C:\Windows
     296 csrss.exe            0x00000000003d1320 TEMP                           C:\Windows\TEMP
     296 csrss.exe            0x00000000003d1320 TMP                            C:\Windows\TEMP
     296 csrss.exe            0x00000000003d1320 USERNAME                       SYSTEM
     296 csrss.exe            0x00000000003d1320 windir                         C:\Windows
To display the version information embedded in PE files, use the verinfo command. Not all PE files have version information, and many malware authors forge it to include false data, but nonetheless this command can be very helpful with identifying binaries and for making correlations with other files.
This plugin only supports printing version information from process executables and DLLs, but later will be expanded to include kernel modules. If you want to filter by module name, use the --regex=REGEX and/or --ignore-case options.
$ python vol.py -f ~/Desktop/win7_trial_64bit.raw --profile=Win7SP0x64 verinfo
Volatility Foundation Volatility Framework 2.4
\SystemRoot\System32\smss.exe
C:\Windows\SYSTEM32\ntdll.dll

C:\Windows\system32\csrss.exe
  File version    : 6.1.7600.16385
  Product version : 6.1.7600.16385
  Flags           :
  OS              : Windows NT
  File Type       : Application
  File Date       :
  CompanyName : Microsoft Corporation
  FileDescription : Client Server Runtime Process
  FileVersion : 6.1.7600.16385 (win7_rtm.090713-1255)
  InternalName : CSRSS.Exe
  LegalCopyright : \xa9 Microsoft Corporation. All rights reserved.
  OriginalFilename : CSRSS.Exe
  ProductName : Microsoft\xae Windows\xae Operating System
  ProductVersion : 6.1.7600.16385

[snip]
This plugin enumerates imported and exported functions from processes, dlls, and kernel drivers. Specifically, it handles functions imported by name or ordinal, functions exported by name or ordinal, and forwarded exports. The output will be very verbose in most cases (functions exported by ntdll, msvcrt, and kernel32 can reach 1000+ alone). So you can either reduce the verbosity by filtering criteria with the command-line options (shown below) or you can use look at the code in enumfunc.py and use it as an example of how to use the IAT and EAT parsing API functions in your own plugin. For example, the apihooks plugin leverages the imports and exports APIs to find functions in memory when checking for hooks.
Also note this plugin is in the contrib directory, so you can pass that to --plugins like this:
$ python vol.py --plugins=contrib/plugins/ -f ~/Desktop/win7_trial_64bit.raw --profile=Win7SP0x64 enumfunc -h
....
  -s, --scan            Scan for objects
  -P, --process-only    Process only
  -K, --kernel-only     Kernel only
  -I, --import-only     Imports only
  -E, --export-only     Exports only
To use pool scanners for finding processes and kernel drivers instead of walking linked lists, use the -s option. This can be useful if you're trying to enumerate functions in hidden processes or drivers. An example of the remaining command-line options is shown below.
To show exported functions in process memory, use -P and -E like this:
$ python vol.py --plugins=contrib/plugins/ -f ~/Desktop/win7_trial_64bit.raw --profile=Win7SP0x64 enumfunc -P -E
Process              Type       Module               Ordinal    Address              Name
lsass.exe            Export     ADVAPI32.dll         1133       0x000007fefd11dd34 CreateWellKnownSid
lsass.exe            Export     ADVAPI32.dll         1134       0x000007fefd17a460 CredBackupCredentials
lsass.exe            Export     ADVAPI32.dll         1135       0x000007fefd170590 CredDeleteA
lsass.exe            Export     ADVAPI32.dll         1136       0x000007fefd1704d0 CredDeleteW
lsass.exe            Export     ADVAPI32.dll         1137       0x000007fefd17a310 CredEncryptAndMarshalBinaryBlob
lsass.exe            Export     ADVAPI32.dll         1138       0x000007fefd17d080 CredEnumerateA
lsass.exe            Export     ADVAPI32.dll         1139       0x000007fefd17cf50 CredEnumerateW
lsass.exe            Export     ADVAPI32.dll         1140       0x000007fefd17ca00 CredFindBestCredentialA
lsass.exe            Export     ADVAPI32.dll         1141       0x000007fefd17c8f0 CredFindBestCredentialW
lsass.exe            Export     ADVAPI32.dll         1142       0x000007fefd130c10 CredFree
lsass.exe            Export     ADVAPI32.dll         1143       0x000007fefd1630f0 CredGetSessionTypes
lsass.exe            Export     ADVAPI32.dll         1144       0x000007fefd1703d0 CredGetTargetInfoA
[snip]
To show imported functions in kernel memory, use -K and -I like this:
$ python vol.py --plugins=contrib/plugins/ -f ~/Desktop/win7_trial_64bit.raw --profile=Win7SP0x64 enumfunc -K -I
Volatility Foundation Volatility Framework 2.4
Process              Type       Module               Ordinal    Address              Name
<KERNEL>             Import     VIDEOPRT.SYS         583        0xfffff80002acc320 ntoskrnl.exeIoRegisterPlugPlayNotification
<KERNEL>             Import     VIDEOPRT.SYS         1325       0xfffff800029f9f30 ntoskrnl.exeRtlAppendStringToString
<KERNEL>             Import     VIDEOPRT.SYS         509        0xfffff800026d06e0 ntoskrnl.exeIoGetAttachedDevice
<KERNEL>             Import     VIDEOPRT.SYS         443        0xfffff800028f7ec0 ntoskrnl.exeIoBuildSynchronousFsdRequest
<KERNEL>             Import     VIDEOPRT.SYS         1466       0xfffff80002699300 ntoskrnl.exeRtlInitUnicodeString
<KERNEL>             Import     VIDEOPRT.SYS         759        0xfffff80002697be0 ntoskrnl.exeKeInitializeEvent
<KERNEL>             Import     VIDEOPRT.SYS         1461       0xfffff8000265e8a0 ntoskrnl.exeRtlInitAnsiString
<KERNEL>             Import     VIDEOPRT.SYS         1966       0xfffff80002685060 ntoskrnl.exeZwSetValueKey
<KERNEL>             Import     VIDEOPRT.SYS         840        0xfffff80002699440 ntoskrnl.exeKeReleaseSpinLock
<KERNEL>             Import     VIDEOPRT.SYS         1190       0xfffff800027a98b0 ntoskrnl.exePoRequestPowerIrp
<KERNEL>             Import     VIDEOPRT.SYS         158        0xfffff800026840f0 ntoskrnl.exeExInterlockedInsertTailList
<KERNEL>             Import     VIDEOPRT.SYS         1810       0xfffff80002684640 ntoskrnl.exeZwClose
[snip]
The memmap command shows you exactly which pages are memory resident, given a specific process DTB (or kernel DTB if you use this plugin on the Idle or System process). It shows you the virtual address of the page, the corresponding physical offset of the page, and the size of the page. The map information generated by this plugin comes from the underlying address space's get_available_addresses method.
As of 2.1, the new column DumpFileOffset helps you correlate the output of memmap with the dump file produced by the memdump plugin. For example, according to the output below, the page at virtual address 0x0000000000058000 in the System process's memory can be found at offset 0x00000000162ed000 of the win7_trial_64bit.raw file. After using memdump to extract the addressable memory of the System process to an individual file, you can find this page at offset 0x8000.
$ python vol.py -f ~/Desktop/win7_trial_64bit.raw --profile=Win7SP0x64 memmap -p 4
Volatility Foundation Volatility Framework 2.4
System pid:      4
Virtual            Physical                         Size     DumpFileOffset
------------------ ------------------ ------------------ ------------------
0x0000000000050000 0x0000000000cbc000             0x1000                0x0
0x0000000000051000 0x0000000015ec6000             0x1000             0x1000
0x0000000000052000 0x000000000f5e7000             0x1000             0x2000
0x0000000000053000 0x0000000005e28000             0x1000             0x3000
0x0000000000054000 0x0000000008b29000             0x1000             0x4000
0x0000000000055000 0x00000000155b8000             0x1000             0x5000
0x0000000000056000 0x000000000926e000             0x1000             0x6000
0x0000000000057000 0x0000000002dac000             0x1000             0x7000
0x0000000000058000 0x00000000162ed000             0x1000             0x8000
[snip]
To extract all memory resident pages in a process (see memmap for details) into an individual file, use the memdump command. Supply the output directory with -D or --dump-dir=DIR.
$ python vol.py -f ~/Desktop/win7_trial_64bit.raw --profile=Win7SP0x64 memdump -p 4 -D dump/
Volatility Foundation Volatility Framework 2.4
************************************************************************
Writing System [     4] to 4.dmp

$ ls -alh dump/4.dmp
-rw-r--r--  1 Michael  staff   111M Jun 24 15:47 dump/4.dmp
To conclude the demonstration we began in the memmap discussion, we should now be able to make an assertion regarding the relationship of the mapped and extracted pages:
$ python vol.py -f ~/Desktop/win7_trial_64bit.raw --profile=Win7SP0x64 volshell
Volatility Foundation Volatility Framework 2.4
Current context: process System, pid=4, ppid=0 DTB=0x187000
Welcome to volshell Current memory image is:
file:///Users/Michael/Desktop/win7_trial_64bit.raw
To get help, type 'hh()'

>>> PAGE_SIZE = 0x1000

>>> assert addrspace().read(0x0000000000058000, PAGE_SIZE) == \
...        addrspace().base.read(0x00000000162ed000, PAGE_SIZE) == \
...        open("dump/4.dmp", "rb").read()[0x8000:0x8000 + PAGE_SIZE]
>>>
To dump a process's executable, use the procdump command. Optionally, pass the --unsafe or -u flags to bypass certain sanity checks used when parsing the PE header. Some malware will intentionally forge size fields in the PE header so that memory dumping tools fail.
Use --memory to include slack space between the PE sections that aren't page aligned. Without --memory you'll get a file that more closely resembles the file on disk, before sections expanded.
For more information, see Andreas Schuster's 4-part series on Reconstructing a Binary. Also see impscan for help rebuilding a binary's import address table.
$ python vol.py -f win7_trial_64bit.raw --profile=Win7SP0x64 procdump -D dump/ -p 296
Volatility Foundation Volatility Framework 2.4
************************************************************************
Dumping csrss.exe, pid:    296 output: executable.296.exe

$ file dump/executable.296.exe
dump/executable.296.exe: PE32+ executable for MS Windows (native) Mono/.Net assembly
The vadinfo command displays extended information about a process's VAD nodes. In particular, it shows:
- The address of the MMVAD structure in kernel memory
- The starting and ending virtual addresses in process memory that the MMVAD structure pertains to
- The VAD Tag
- The VAD flags, control flags, etc
- The name of the memory mapped file (if one exists)
- The memory protection constant (permissions). Note there is a difference between the original protection and current protection. The original protection is derived from the flProtect parameter to VirtualAlloc. For example you can reserve memory (MEM_RESERVE) with protection PAGE_NOACCESS (original protection). Later, you can call VirtualAlloc again to commit (MEM_COMMIT) and specify PAGE_READWRITE (becomes current protection). The vadinfo command shows the original protection only. Thus, just because you see PAGE_NOACCESS here, it doesn't mean code in the region cannot be read, written, or executed.
    $ python vol.py -f ~/Desktop/win7_trial_64bit.raw --profile=Win7SP0x64 vadinfo -p 296
    Volatility Foundation Volatility Framework 2.4
    ************************************************************************
    Pid:    296
    VAD node @ 0xfffffa8000c00620 Start 0x000000007f0e0000 End 0x000000007ffdffff Tag VadS
    Flags: PrivateMemory: 1, Protection: 1
    Protection: PAGE_READONLY
    Vad Type: VadNone

    [snip]

    VAD node @ 0xfffffa8000c04ce0 Start 0x000007fefcd00000 End 0x000007fefcd10fff Tag Vad
    Flags: CommitCharge: 2, Protection: 7, VadType: 2
    Protection: PAGE_EXECUTE_WRITECOPY
    Vad Type: VadImageMap
    ControlArea @fffffa8000c04d70 Segment fffff8a000c45c10
    Dereference list: Flink 00000000, Blink 00000000
    NumberOfSectionReferences:          0 NumberOfPfnReferences:          13
    NumberOfMappedViews:                2 NumberOfUserReferences:          2
    WaitingForDeletion Event:  00000000
    Control Flags: Accessed: 1, File: 1, Image: 1
    FileObject @fffffa8000c074d0, Name: \Windows\System32\basesrv.dll
    First prototype PTE: fffff8a000c45c58 Last contiguous PTE: fffffffffffffffc
    Flags2: Inherit: 1
For more information on the VAD, see BDG's The VAD Tree: A Process-Eye View of Physical Memory.
To inspect a process's VAD nodes in table form, use the vadwalk command.
$ python vol.py -f ~/Desktop/win7_trial_64bit.raw --profile=Win7SP0x64 vadwalk -p 296
Volatility Foundation Volatility Framework 2.4
************************************************************************
Pid:    296
Address            Parent             Left               Right              Start              End                Tag
------------------ ------------------ ------------------ ------------------ ------------------ ------------------ ----
0xfffffa8000c00620 0x0000000000000000 0xfffffa8000deaa40 0xfffffa8000c043d0 0x000000007f0e0000 0x000000007ffdffff VadS
0xfffffa8000deaa40 0xfffffa8000c00620 0xfffffa8000bc4660 0xfffffa80011b8d80 0x0000000000ae0000 0x0000000000b1ffff VadS
0xfffffa8000bc4660 0xfffffa8000deaa40 0xfffffa8000c04260 0xfffffa8000c91010 0x00000000004d0000 0x0000000000650fff Vadm
0xfffffa8000c04260 0xfffffa8000bc4660 0xfffffa8000c82010 0xfffffa80012acce0 0x00000000002a0000 0x000000000039ffff VadS
0xfffffa8000c82010 0xfffffa8000c04260 0xfffffa8000cbce80 0xfffffa8000c00330 0x00000000001f0000 0x00000000001f0fff Vadm
0xfffffa8000cbce80 0xfffffa8000c82010 0xfffffa8000bc4790 0xfffffa8000d9bb80 0x0000000000180000 0x0000000000181fff Vad
0xfffffa8000bc4790 0xfffffa8000cbce80 0xfffffa8000c00380 0xfffffa8000e673a0 0x0000000000100000 0x0000000000166fff Vad
0xfffffa8000c00380 0xfffffa8000bc4790 0x0000000000000000 0x0000000000000000 0x0000000000000000 0x00000000000fffff VadS
[snip]
To display the VAD nodes in a visual tree form, use the vadtree command.
$ python vol.py -f ~/Desktop/win7_trial_64bit.raw --profile=Win7SP0x64 vadtree -p 296
Volatility Foundation Volatility Framework 2.4
************************************************************************
Pid:    296
 0x000000007f0e0000 - 0x000000007ffdffff
  0x0000000000ae0000 - 0x0000000000b1ffff
   0x00000000004d0000 - 0x0000000000650fff
    0x00000000002a0000 - 0x000000000039ffff
     0x00000000001f0000 - 0x00000000001f0fff
      0x0000000000180000 - 0x0000000000181fff
       0x0000000000100000 - 0x0000000000166fff
        0x0000000000000000 - 0x00000000000fffff
        0x0000000000170000 - 0x0000000000170fff
       0x00000000001a0000 - 0x00000000001a1fff
        0x0000000000190000 - 0x0000000000190fff
        0x00000000001b0000 - 0x00000000001effff
      0x0000000000240000 - 0x000000000024ffff
       0x0000000000210000 - 0x0000000000216fff
        0x0000000000200000 - 0x000000000020ffff
[snip]
If you want to view the balanced binary tree in Graphviz format, just add --output=dot --output-file=graph.dot to your command. Then you can open graph.dot in any Graphviz-compatible viewer. This plugin also supports color coding the output based on the regions that contain stacks, heaps, mapped files, DLLs, etc. A partial example is shown below using Omnigraffle:
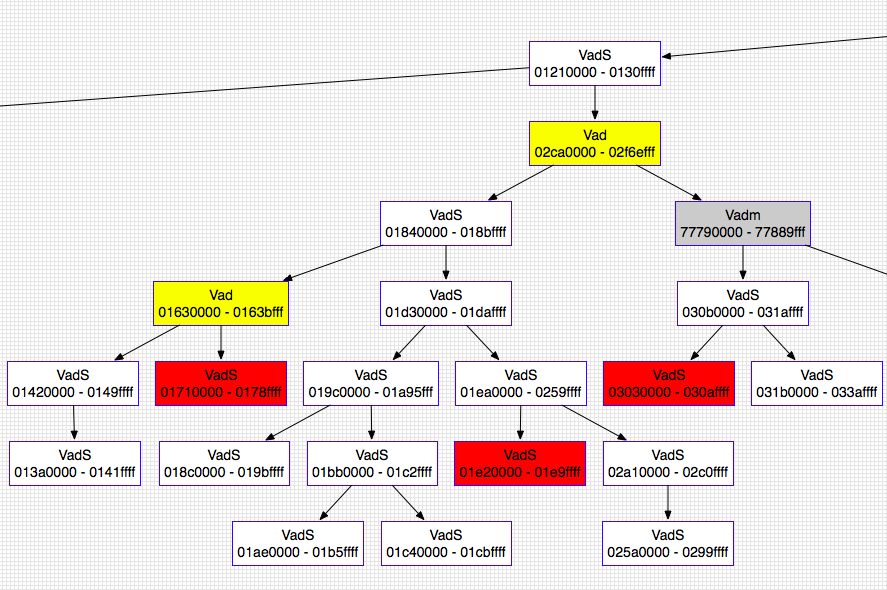
Fillcolor Legend:
- Red: Heaps
- Gray: DLLs
- Green: Stacks
- Yellow: Mapped Files
To extract the range of pages described by a VAD node, use the vaddump command. This is similar to memdump, except the pages belonging to each VAD node are placed in separate files (named according to the starting and ending addresses) instead of one large conglomerate file. If any pages in the range are not memory resident, they're padded with 0's using the address space's zread() method.
$ python vol.py -f ~/Desktop/win7_trial_64bit.raw --profile=Win7SP0x64 vaddump -D vads
Volatility Foundation Volatility Framework 2.4
Pid        Process              Start              End                Result
---------- -------------------- ------------------ ------------------ ------
         4 System               0x0000000076d40000 0x0000000076eeafff vads/System.17fef9e0.0x0000000076d40000-0x0000000076eeafff.dmp
         4 System               0x0000000000040000 0x0000000000040fff vads/System.17fef9e0.0x0000000000040000-0x0000000000040fff.dmp
         4 System               0x0000000000010000 0x0000000000032fff vads/System.17fef9e0.0x0000000000010000-0x0000000000032fff.dmp
         4 System               0x000000007ffe0000 0x000000007ffeffff vads/System.17fef9e0.0x000000007ffe0000-0x000000007ffeffff.dmp
         4 System               0x0000000076f20000 0x000000007709ffff vads/System.17fef9e0.0x0000000076f20000-0x000000007709ffff.dmp
       208 smss.exe             0x000000007efe0000 0x000000007ffdffff vads/smss.exe.176e97f0.0x000000007efe0000-0x000000007ffdffff.dmp
       208 smss.exe             0x00000000003d0000 0x00000000004cffff vads/smss.exe.176e97f0.0x00000000003d0000-0x00000000004cffff.dmp
       208 smss.exe             0x0000000000100000 0x0000000000100fff vads/smss.exe.176e97f0.0x0000000000100000-0x0000000000100fff.dmp
       208 smss.exe             0x0000000000000000 0x00000000000fffff vads/smss.exe.176e97f0.0x0000000000000000-0x00000000000fffff.dmp
       208 smss.exe             0x0000000000190000 0x000000000020ffff vads/smss.exe.176e97f0.0x0000000000190000-0x000000000020ffff.dmp
       208 smss.exe             0x0000000047a90000 0x0000000047aaffff vads/smss.exe.176e97f0.0x0000000047a90000-0x0000000047aaffff.dmp
       208 smss.exe             0x00000000005e0000 0x000000000065ffff vads/smss.exe.176e97f0.0x00000000005e0000-0x000000000065ffff.dmp
[snip]

$ ls -al vads/
total 123720
drwxr-xr-x  69 michaelligh  staff      2346 Apr  6 13:12 .
drwxr-xr-x  37 michaelligh  staff      1258 Apr  6 13:11 ..
-rw-r--r--   1 michaelligh  staff    143360 Apr  6 13:12 System.17fef9e0.0x0000000000010000-0x0000000000032fff.dmp
-rw-r--r--   1 michaelligh  staff      4096 Apr  6 13:12 System.17fef9e0.0x0000000000040000-0x0000000000040fff.dmp
-rw-r--r--   1 michaelligh  staff   1748992 Apr  6 13:12 System.17fef9e0.0x0000000076d40000-0x0000000076eeafff.dmp
-rw-r--r--   1 michaelligh  staff   1572864 Apr  6 13:12 System.17fef9e0.0x0000000076f20000-0x000000007709ffff.dmp
-rw-r--r--   1 michaelligh  staff     65536 Apr  6 13:12 System.17fef9e0.0x000000007ffe0000-0x000000007ffeffff.dmp
-rw-r--r--   1 michaelligh  staff   1048576 Apr  6 13:12 csrss.exe.176006c0.0x0000000000000000-0x00000000000fffff.dmp
-rw-r--r--   1 michaelligh  staff    421888 Apr  6 13:12 csrss.exe.176006c0.0x0000000000100000-0x0000000000166fff.dmp
-rw-r--r--   1 michaelligh  staff      4096 Apr  6 13:12 csrss.exe.176006c0.0x0000000000170000-0x0000000000170fff.dmp
-rw-r--r--   1 michaelligh  staff      8192 Apr  6 13:12 csrss.exe.176006c0.0x0000000000180000-0x0000000000181fff.dmp
[snip]
The files are named like this:
ProcessName.PhysicalOffset.StartingVPN.EndingVPN.dmp
The reason the PhysicalOffset field exists is so you can distinguish between two processes with the same name.
The evtlogs command extracts and parses binary event logs from memory. Binary event logs are found on Windows XP and 2003 machines, therefore this plugin only works on these architectures. These files are extracted from VAD of the services.exe process, parsed and dumped to a specified location.
$ python vol.py -f WinXPSP1x64.vmem --profile=WinXPSP2x64 evtlogs -D output
Volatility Foundation Volatility Framework 2.4
Parsed data sent to appevent.txt
Parsed data sent to secevent.txt
Parsed data sent to sysevent.txt
There is also an option (--save-evt) to dump raw event logs for parsing with external tools:
$ python vol.py -f WinXPSP1x64.vmem --profile=WinXPSP2x64 evtlogs
--save-evt -D output
Volatility Foundation Volatility Framework 2.4
Saved raw .evt file to appevent.evt
Parsed data sent to appevent.txt
Saved raw .evt file to secevent.evt
Parsed data sent to secevent.txt
Saved raw .evt file to sysevent.evt
Parsed data sent to sysevent.txt
Parsed output is pipe delimited to make it easier to import into excel files and the "messages" are separated by semicolons:
$ cat output/secevent.txt

2012-01-17 12:01:27|secevent.evt|MACHINENAME|S-1-5-18 (Local System)|Security|612|Success|-;-;+;-;-;-;-;-;-;-;-;-;-;-;-;-;+;-;MACHINENAME$;;(0x0,0x3E7)
2012-01-17 17:06:18|secevent.evt|MACHINENAME|S-1-5-19 (NT Authority)|Security|528|Success|LOCAL SERVICE;NT AUTHORITY;(0x0,0x3E5);5;Advapi;Negotiate;;-;MACHINENAME$(0x0,0x3E7);252;-;-;-
2012-01-17 17:06:18|secevent.evt|MACHINENAME|S-1-5-19 (NT Authority)|Security|576|Success|LOCAL SERVICE;NT AUTHORITY;(0x0,0x3E5);SeAuditPrivilege            SeAssignPrimaryTokenPrivilege                   SeImpersonatePrivilege
2012-01-17 17:06:19|secevent.evt|MACHINENAME|S-1-5-20 (NT Authority)|Security|528|Success|NETWORK SERVICE;NT AUTHORITY;(0x0,0x3E4);5;Advapi;Negotiate;;-;MACHINENAME$(0x0,0x3E7);252;-;-;-
2012-01-17 17:06:19|secevent.evt|MACHINENAME|S-1-5-20 (NT Authority)|Security|576|Success|NETWORK SERVICE;NTAUTHORITY;(0x0,0x3E4);SeAuditPrivilege                  SeAssignPrimaryTokenPrivilege                   SeImpersonatePrivilege

[snip]
If the --verbose flag is used, SIDs are also evaluated and placed in the parsed output instead of the defaulting raw SID. This action takes longer to run, since the plugin has to calculate each of the service SID and user SID from registry entries.
This plugin recovers fragments of IE history index.dat cache files. It can find basic accessed links (via FTP or HTTP), redirected links (--REDR), and deleted entries (--LEAK). It applies to any process which loads and uses the wininet.dll library, not just Internet Explorer. Typically that includes Windows Explorer and even malware samples. For more information, see HowTo: Scan for Internet Cache/History and URLs.
$ python vol.py -f exemplar17_1.vmem iehistory
Volatility Foundation Volatility Framework 2.4
**************************************************
Process: 1928 explorer.exe
Cache type "URL " at 0xf25100
Record length: 0x100
Location: Visited: foo@http://192.168.30.129/malware/40024.exe
Last modified: 2009-01-08 01:52:09
Last accessed: 2009-01-08 01:52:09
File Offset: 0x100, Data Offset: 0x0, Data Length: 0xa0
**************************************************
Process: 1928 explorer.exe
Cache type "URL " at 0xf25300
Record length: 0x180
Location: Visited: foo@http://www.abcjmp.com/jump1/?affiliate=mu1&subid=88037&terms=eminem&sid=Z605044303%40%40wMfNTNxkTM1EzX5QzNy81My8lM18FN4gTM2gzNzITM&a=zh5&mr=1&rc=0
Last modified: 2009-01-08 01:52:44
Last accessed: 2009-01-08 01:52:44
File Offset: 0x180, Data Offset: 0x0, Data Length: 0x108
**************************************************
.....
To view the list of kernel drivers loaded on the system, use the modules command. This walks the doubly-linked list of LDR_DATA_TABLE_ENTRY structures pointed to by PsLoadedModuleList. Similar to the pslist command, this relies on finding the KDBG structure. In rare cases, you may need to use kdbgscan to find the most appropriate KDBG structure address and then supply it to this plugin like --kdbg=ADDRESS.
It cannot find hidden/unlinked kernel drivers, however modscan serves that purpose. Also, since this plugin uses list walking techniques, you typically can assume that the order the modules are displayed in the output is the order they were loaded on the system. For example, below, ntoskrnl.exe was first to load, followed by hal.dll, etc.
$ python vol.py -f ~/Desktop/win7_trial_64bit.raw --profile=Win7SP0x64 modules
Volatility Foundation Volatility Framework 2.4
Offset(V)          Name                 Base                             Size File
------------------ -------------------- ------------------ ------------------ ----
0xfffffa80004a11a0 ntoskrnl.exe         0xfffff8000261a000           0x5dd000 \SystemRoot\system32\ntoskrnl.exe
0xfffffa80004a10b0 hal.dll              0xfffff80002bf7000            0x49000 \SystemRoot\system32\hal.dll
0xfffffa80004a7950 kdcom.dll            0xfffff80000bb4000             0xa000 \SystemRoot\system32\kdcom.dll
0xfffffa80004a7860 mcupdate.dll         0xfffff88000c3a000            0x44000 \SystemRoot\system32\mcupdate_GenuineIntel.dll
0xfffffa80004a7780 PSHED.dll            0xfffff88000c7e000            0x14000 \SystemRoot\system32\PSHED.dll
0xfffffa80004a7690 CLFS.SYS             0xfffff88000c92000            0x5e000 \SystemRoot\system32\CLFS.SYS
0xfffffa80004a8010 CI.dll               0xfffff88000cf0000            0xc0000 \SystemRoot\system32\CI.dll
[snip]
The output shows the offset of the LDR_DATA_TABLE_ENTRY structure, which is a virtual address by default but can be specified as a physical address with the -P switch as shown below. In either case, the Base column is the virtual address of the module's base in kernel memory (where you'd expect to find the PE header).
$ python vol.py -f ~/Desktop/win7_trial_64bit.raw --profile=Win7SP0x64 modules -P
Volatility Foundation Volatility Framework 2.4
Offset(P)          Name                 Base                             Size File
------------------ -------------------- ------------------ ------------------ ----
0x0000000017fe01a0 ntoskrnl.exe         0xfffff8000261a000           0x5dd000 \SystemRoot\system32\ntoskrnl.exe
0x0000000017fe00b0 hal.dll              0xfffff80002bf7000            0x49000 \SystemRoot\system32\hal.dll
0x0000000017fe6950 kdcom.dll            0xfffff80000bb4000             0xa000 \SystemRoot\system32\kdcom.dll
0x0000000017fe6860 mcupdate.dll         0xfffff88000c3a000            0x44000 \SystemRoot\system32\mcupdate_GenuineIntel.dll
0x0000000017fe6780 PSHED.dll            0xfffff88000c7e000            0x14000 \SystemRoot\system32\PSHED.dll
0x0000000017fe6690 CLFS.SYS             0xfffff88000c92000            0x5e000 \SystemRoot\system32\CLFS.SYS
0x0000000017fe7010 CI.dll               0xfffff88000cf0000            0xc0000 \SystemRoot\system32\CI.dll
[snip]
The modscan command finds LDR_DATA_TABLE_ENTRY structures by scanning physical memory for pool tags. This can pick up previously unloaded drivers and drivers that have been hidden/unlinked by rootkits. Unlike modules the order of results has no relationship with the order in which the drivers loaded. As you can see below, DumpIt.sys was found at the lowest physical offset, but it was probably one of the last drivers to load (since it was used to acquire memory).
$ python vol.py -f ~/Desktop/win7_trial_64bit.raw --profile=Win7SP0x64 modscan
Volatility Foundation Volatility Framework 2.4
Offset(P)          Name                 Base                             Size File
------------------ -------------------- ------------------ ------------------ ----
0x00000000173b90b0 DumpIt.sys           0xfffff88003980000            0x11000 \??\C:\Windows\SysWOW64\Drivers\DumpIt.sys
0x000000001745b180 mouhid.sys           0xfffff880037e9000             0xd000 \SystemRoot\system32\DRIVERS\mouhid.sys
0x0000000017473010 lltdio.sys           0xfffff88002585000            0x15000 \SystemRoot\system32\DRIVERS\lltdio.sys
0x000000001747f010 rspndr.sys           0xfffff8800259a000            0x18000 \SystemRoot\system32\DRIVERS\rspndr.sys
0x00000000174cac40 dxg.sys              0xfffff96000440000            0x1e000 \SystemRoot\System32\drivers\dxg.sys
0x0000000017600190 monitor.sys          0xfffff8800360c000             0xe000 \SystemRoot\system32\DRIVERS\monitor.sys
0x0000000017601170 HIDPARSE.SYS         0xfffff880037de000             0x9000 \SystemRoot\system32\DRIVERS\HIDPARSE.SYS
0x0000000017604180 USBD.SYS             0xfffff880037e7000             0x2000 \SystemRoot\system32\DRIVERS\USBD.SYS
0x0000000017611d70 cdrom.sys            0xfffff88001944000            0x2a000 \SystemRoot\system32\DRIVERS\cdrom.sys
[snip]
To extract a kernel driver to a file, use the moddump command. Supply the output directory with -D or --dump-dir=DIR. Without any additional parameters, all drivers identified by modlist will be dumped. If you want a specific driver, supply a regular expression of the driver's name with --regex=REGEX or the module's base address with --base=BASE.
For more information, see BDG's Plugin Post: Moddump.
$ python vol.py -f ~/Desktop/win7_trial_64bit.raw --profile=Win7SP0x64 moddump -D drivers/
Volatility Foundation Volatility Framework 2.4
Module Base        Module Name          Result
------------------ -------------------- ------
0xfffff8000261a000 ntoskrnl.exe         OK: driver.fffff8000261a000.sys
0xfffff80002bf7000 hal.dll              OK: driver.fffff80002bf7000.sys
0xfffff88000e5c000 intelide.sys         OK: driver.fffff88000e5c000.sys
0xfffff8800349b000 mouclass.sys         OK: driver.fffff8800349b000.sys
0xfffff88000f7c000 msisadrv.sys         OK: driver.fffff88000f7c000.sys
0xfffff880035c3000 ndistapi.sys         OK: driver.fffff880035c3000.sys
0xfffff88002c5d000 pacer.sys            OK: driver.fffff88002c5d000.sys
[snip]
Similar to dlldump, if critical parts of the PE header are not memory resident, then rebuilding/extracting the driver may fail. Additionally, for drivers that are mapped in different sessions (like win32k.sys), there is currently no way to specify which session to use when acquiring the driver sample.
To list the functions in the Native and GUI SSDTs, use the ssdt command. This displays the index, function name, and owning driver for each entry in the SSDT. Please note the following:
-
Windows has 4 SSDTs by default (you can add more with KeAddSystemServiceTable), but only 2 of them are used - one for Native functions in the NT module, and one for GUI functions in the win32k.sys module.
-
There are multiple ways to locate the SSDTs in memory. Most tools do it by finding the exported KeServiceDescriptorTable symbol in the NT module, but this is not the way Volatility works.
-
For x86 systems, Volatility scans for ETHREAD objects (see the thrdscan command) and gathers all unique ETHREAD.Tcb.ServiceTable pointers. This method is more robust and complete, because it can detect when rootkits make copies of the existing SSDTs and assign them to particular threads. Also see the threads command.
-
For x64 systems (which do not have an ETHREAD.Tcb.ServiceTable member) Volatility disassembles code in ntKeAddSystemServiceTable and finds its references to the KeServiceDescriptorTable and KeServiceDescriptorTableShadow symbols.
-
The order and total number of functions in the SSDTs differ across operating system versions. Thus, Volatility stores the information in a per-profile (OS) dictionary which is auto-generated and cross-referenced using the ntoskrnl.exe, ntdll.dll, win32k.sys, user32.dll and gdi32.dll modules from the respective systems.
-
For more information, see BDG's Auditing the System Call Table.
    $ python vol.py -f ~/Desktop/win7_trial_64bit.raw --profile=Win7SP0x64 ssdt
    Volatility Foundation Volatility Framework 2.4
    [x64] Gathering all referenced SSDTs from KeAddSystemServiceTable...
    Finding appropriate address space for tables...
    SSDT[0] at fffff8000268cb00 with 401 entries
      Entry 0x0000: 0xfffff80002a9d190 (NtMapUserPhysicalPagesScatter) owned by ntoskrnl.exe
      Entry 0x0001: 0xfffff80002983a00 (NtWaitForSingleObject) owned by ntoskrnl.exe
      Entry 0x0002: 0xfffff80002683dd0 (NtCallbackReturn) owned by ntoskrnl.exe
      Entry 0x0003: 0xfffff800029a6b10 (NtReadFile) owned by ntoskrnl.exe
      Entry 0x0004: 0xfffff800029a4bb0 (NtDeviceIoControlFile) owned by ntoskrnl.exe
      Entry 0x0005: 0xfffff8000299fee0 (NtWriteFile) owned by ntoskrnl.exe
      Entry 0x0006: 0xfffff80002945dc0 (NtRemoveIoCompletion) owned by ntoskrnl.exe
      Entry 0x0007: 0xfffff80002942f10 (NtReleaseSemaphore) owned by ntoskrnl.exe
      Entry 0x0008: 0xfffff8000299ada0 (NtReplyWaitReceivePort) owned by ntoskrnl.exe
      Entry 0x0009: 0xfffff80002a6ce20 (NtReplyPort) owned by ntoskrnl.exe

    [snip]

    SSDT[1] at fffff96000101c00 with 827 entries
      Entry 0x1000: 0xfffff960000f5580 (NtUserGetThreadState) owned by win32k.sys
      Entry 0x1001: 0xfffff960000f2630 (NtUserPeekMessage) owned by win32k.sys
      Entry 0x1002: 0xfffff96000103c6c (NtUserCallOneParam) owned by win32k.sys
      Entry 0x1003: 0xfffff96000111dd0 (NtUserGetKeyState) owned by win32k.sys
      Entry 0x1004: 0xfffff9600010b1ac (NtUserInvalidateRect) owned by win32k.sys
      Entry 0x1005: 0xfffff96000103e70 (NtUserCallNoParam) owned by win32k.sys
      Entry 0x1006: 0xfffff960000fb5a0 (NtUserGetMessage) owned by win32k.sys
      Entry 0x1007: 0xfffff960000dfbec (NtUserMessageCall) owned by win32k.sys
      Entry 0x1008: 0xfffff960001056c4 (NtGdiBitBlt) owned by win32k.sys
      Entry 0x1009: 0xfffff960001fd750 (NtGdiGetCharSet) owned by win32k.sys
To filter all functions which point to ntoskrnl.exe and win32k.sys, you can use egrep on command-line. This will only show hooked SSDT functions.
$ python vol.py -f ~/Desktop/win7_trial_64bit.raw --profile=Win7SP0x64 ssdt | egrep -v '(ntos|win32k)'
Note that the NT module on your system may be ntkrnlpa.exe or ntkrnlmp.exe - so check that before using egrep of you'll be filtering the wrong module name. Also be aware that this isn't a hardened technique for finding hooks, as malware can load a driver named win32ktesting.sys and bypass your filter.
To find DRIVER_OBJECTs in physical memory using pool tag scanning, use the driverscan command. This is another way to locate kernel modules, although not all kernel modules have an associated DRIVER_OBJECT. The DRIVER_OBJECT is what contains the 28 IRP (Major Function) tables, thus the driverirp command is based on the methodology used by driverscan.
For more information, see Andreas Schuster's Scanning for Drivers.
$ python vol.py -f ~/Desktop/win7_trial_64bit.raw --profile=Win7SP0x64 driverscan
Volatility Foundation Volatility Framework 2.4
Offset(P)          #Ptr #Hnd Start                            Size Service Key          Name         Driver Name
------------------ ---- ---- ------------------ ------------------ -------------------- ------------ -----------
0x00000000174c6350    3    0 0xfffff880037e9000             0xd000 mouhid               mouhid       \Driver\mouhid
0x0000000017660cb0    3    0 0xfffff8800259a000            0x18000 rspndr               rspndr       \Driver\rspndr
0x0000000017663e70    3    0 0xfffff88002585000            0x15000 lltdio               lltdio       \Driver\lltdio
0x0000000017691d70    3    0 0xfffff88001944000            0x2a000 cdrom                cdrom        \Driver\cdrom
0x0000000017692a50    3    0 0xfffff8800196e000             0x9000 Null                 Null         \Driver\Null
0x0000000017695e70    3    0 0xfffff88001977000             0x7000 Beep                 Beep         \Driver\Beep
0x00000000176965c0    3    0 0xfffff8800197e000             0xe000 VgaSave              VgaSave      \Driver\VgaSave
0x000000001769fb00    4    0 0xfffff880019c1000             0x9000 RDPCDD               RDPCDD       \Driver\RDPCDD
0x00000000176a1720    3    0 0xfffff880019ca000             0x9000 RDPENCDD             RDPENCDD     \Driver\RDPENCDD
0x00000000176a2230    3    0 0xfffff880019d3000             0x9000 RDPREFMP             RDPREFMP     \Driver\RDPREFMP
[snip]
To find FILE_OBJECTs in physical memory using pool tag scanning, use the filescan command. This will find open files even if a rootkit is hiding the files on disk and if the rootkit hooks some API functions to hide the open handles on a live system. The output shows the physical offset of the FILE_OBJECT, file name, number of pointers to the object, number of handles to the object, and the effective permissions granted to the object.
For more information, see Andreas Schuster's Scanning for File Objects and Linking File Objects To Processes.
$ python vol.py -f ~/Desktop/win7_trial_64bit.raw --profile=Win7SP0x64 filescan
Volatility Foundation Volatility Framework 2.4
Offset(P)            #Ptr   #Hnd Access Name
------------------ ------ ------ ------ ----
0x000000000126f3a0     14      0 R--r-d \Windows\System32\mswsock.dll
0x000000000126fdc0     11      0 R--r-d \Windows\System32\ssdpsrv.dll
0x000000000468f7e0      6      0 R--r-d \Windows\System32\cryptsp.dll
0x000000000468fdc0     16      0 R--r-d \Windows\System32\Apphlpdm.dll
0x00000000048223a0      1      1 ------ \Endpoint
0x0000000004822a30     16      0 R--r-d \Windows\System32\kerberos.dll
0x0000000004906070     13      0 R--r-d \Windows\System32\wbem\repdrvfs.dll
0x0000000004906580      9      0 R--r-d \Windows\SysWOW64\netprofm.dll
0x0000000004906bf0      9      0 R--r-d \Windows\System32\wbem\wmiutils.dll
0x00000000049ce8e0      2      1 R--rwd \$Extend\$ObjId
0x00000000049cedd0      1      1 R--r-d \Windows\System32\en-US\vsstrace.dll.mui
0x0000000004a71070     17      1 R--r-d \Windows\System32\en-US\pnidui.dll.mui
0x0000000004a71440     11      0 R--r-d \Windows\System32\nci.dll
0x0000000004a719c0      1      1 ------ \srvsvc
[snip]
To scan physical memory for KMUTANT objects with pool tag scanning, use the mutantscan command. By default, it displays all objects, but you can pass -s or --silent to only show named mutexes. The CID column contains the process ID and thread ID of the mutex owner if one exists.
For more information, see Andreas Schuster's Searching for Mutants.
$ python -f ~/Desktop/win7_trial_64bit.raw --profile=Win7SP0x64 mutantscan --silent
Volatility Foundation Volatility Framework 2.4
Offset(P)          #Ptr #Hnd Signal Thread                   CID Name
------------------ ---- ---- ------ ------------------ --------- ----
0x000000000f702630    2    1      1 0x0000000000000000           {A3BD3259-3E4F-428a-84C8-F0463A9D3EB5}
0x00000000102fd930    2    1      1 0x0000000000000000           Feed Arbitration Shared Memory Mutex [ User : S-1-5-21-2628989162-3383567662-1028919141-1000 ]
0x00000000104e5e60    3    2      1 0x0000000000000000           ZoneAttributeCacheCounterMutex
0x0000000010c29e40    2    1      1 0x0000000000000000           _MSFTHISTORY_LOW_
0x0000000013035080    2    1      1 0x0000000000000000           c:userstestingappdatalocalmicrosoftfeeds cache
0x000000001722dfc0    2    1      1 0x0000000000000000           c:userstestingappdataroamingmicrosoftwindowsietldcachelow
0x00000000172497f0    2    1      1 0x0000000000000000           LRIEElevationPolicyMutex
0x000000001724bfc0    3    2      1 0x0000000000000000           BrowserEmulationSharedMemoryMutex
0x000000001724f400    2    1      1 0x0000000000000000           c:userstestingappdatalocalmicrosoftwindowshistorylowhistory.ie5mshist012012022220120223
0x000000001724f4c0    4    3      1 0x0000000000000000           _SHMSFTHISTORY_
0x00000000172517c0    2    1      1 0x0000000000000000           __DDrawExclMode__
0x00000000172783a0    2    1      1 0x0000000000000000           Lowhttp://sourceforge.net/
0x00000000172db840    4    3      1 0x0000000000000000           ConnHashTable<1892>_HashTable_Mutex
0x00000000172de1d0    2    1      1 0x0000000000000000           Feeds Store Mutex S-1-5-21-2628989162-3383567662-1028919141-1000
0x00000000173b8080    2    1      1 0x0000000000000000           DDrawDriverObjectListMutex
0x00000000173bd340    2    1      0 0xfffffa8000a216d0 1652:2000 ALTTAB_RUNNING_MUTEX
0x0000000017449c40    2    1      1 0x0000000000000000           DDrawWindowListMutex
[snip]
This plugin scans for symbolic link objects and outputs their information. In the past, this has been used to link drive letters (i.e. D:, E:, F:, etc) to true crypt volumes (i.e. \Device\TrueCryptVolume). For more information, see Symbolic Link Objects and Identifying a Mounted True Crypt Volume from Artifacts in Volatile Memory.
$ python -f ~/Desktop/win7_trial_64bit.raw --profile=Win7SP0x64 symlinkscan
Volatility Foundation Volatility Framework 2.4
Offset(P)            #Ptr   #Hnd Creation time            From                 To
------------------ ------ ------ ------------------------ -------------------- ------------------------------------------------------------
0x0000000000469780      1      0 2012-02-22 20:03:13      UMB#UMB#1...e1ba19f} \Device\00000048
0x0000000000754560      1      0 2012-02-22 20:03:15      ASYNCMAC             \Device\ASYNCMAC
0x0000000000ef6cf0      2      1 2012-02-22 19:58:24      0                    \BaseNamedObjects
0x00000000014b2a10      1      0 2012-02-22 20:02:10      LanmanRedirector     \Device\Mup\;LanmanRedirector
0x00000000053e56f0      1      0 2012-02-22 20:03:15      SW#{eeab7...abac361} \Device\KSENUM#00000001
0x0000000005cc0770      1      0 2012-02-22 19:58:20      WanArpV6             \Device\WANARPV6
0x0000000005cc0820      1      0 2012-02-22 19:58:20      WanArp               \Device\WANARP
0x0000000008ffa680      1      0 2012-02-22 19:58:24      Global               \BaseNamedObjects
0x0000000009594810      1      0 2012-02-22 19:58:24      KnownDllPath         C:\Windows\syswow64
0x000000000968f5f0      1      0 2012-02-22 19:58:23      KnownDllPath         C:\Windows\system32
0x000000000ab24060      1      0 2012-02-22 19:58:20      Volume{3b...f6e6963} \Device\CdRom0
0x000000000ab24220      1      0 2012-02-22 19:58:21      {EE0434CC...863ACC2} \Device\NDMP2
0x000000000abd3460      1      0 2012-02-22 19:58:21      ACPI#PNP0...91405dd} \Device\00000041
0x000000000abd36f0      1      0 2012-02-22 19:58:21      {802389A0...A90C31A} \Device\NDMP3
[snip]
To find ETHREAD objects in physical memory with pool tag scanning, use the thrdscan command. Since an ETHREAD contains fields that identify its parent process, you can use this technique to find hidden processes. One such use case is documented in the psxview command. Also, for verbose details, try the threads plugin.
$ python vol.py -f ~/Desktop/win7_trial_64bit.raw --profile=Win7SP0x64 thrdscan
Volatility Foundation Volatility Framework 2.4
Offset(P)             PID    TID      Start Address Create Time               Exit Time
------------------ ------ ------ ------------------ ------------------------- -------------------------
0x0000000008df68d0    280    392         0x77943260 2012-02-22 19:08:18
0x000000000eac3850   2040    144         0x76d73260 2012-02-22 11:28:59       2012-02-22 11:29:04
0x000000000fd82590    880   1944         0x76d73260 2012-02-22 20:02:29       2012-02-22 20:02:29
0x00000000103d15f0    880    884         0x76d73260 2012-02-22 19:58:43
0x00000000103e5480   1652   1788 0xfffff8a0010ed490 2012-02-22 20:03:44
0x00000000105a3940    916    324         0x76d73260 2012-02-22 20:02:07       2012-02-22 20:02:09
0x00000000105b3560    816    824         0x76d73260 2012-02-22 19:58:42
0x00000000106d1710    916   1228         0x76d73260 2012-02-22 20:02:11
0x0000000010a349a0    816    820         0x76d73260 2012-02-22 19:58:41
0x0000000010bd1060   1892   2280         0x76d73260 2012-02-22 11:26:13
0x0000000010f24230    628    660         0x76d73260 2012-02-22 19:58:34
0x0000000010f27060    568    648 0xfffff8a0017c6650 2012-02-22 19:58:34
[snip]
An important concept that every computer scientist, especially those who have spent time doing operating system research, is intimately familiar with is that of caching. Files are cached in memory for system performance as they are accessed and used. This makes the cache a valuable source from a forensic perspective since we are able to retrieve files that were in use correctly, instead of file carving which does not make use of how items are mapped in memory. Files may not be completely mapped in memory (also for performance), so missing sections are zero padded. Files dumped from memory can then be processed with external tools.
For more information see AAron Walter's post: MoVP 4.4 Cache Rules Everything Around Me(mory).
There are several options in the dumpfiles plugin, for example:
  -r REGEX, --regex=REGEX
                        Dump files matching REGEX
  -i, --ignore-case     Ignore case in pattern match
  -o OFFSET, --offset=OFFSET
                        Dump files for Process with physical address OFFSET
  -Q PHYSOFFSET, --physoffset=PHYSOFFSET
                        Dump File Object at physical address PHYSOFFSET
  -D DUMP_DIR, --dump-dir=DUMP_DIR
                        Directory in which to dump extracted files
  -S SUMMARY_FILE, --summary-file=SUMMARY_FILE
                        File where to store summary information
  -p PID, --pid=PID     Operate on these Process IDs (comma-separated)
  -n, --name            Include extracted filename in output file path
  -u, --unsafe          Relax safety constraints for more data
  -F FILTER, --filter=FILTER
                        Filters to apply (comma-separated)
By default, dumpfiles iterates through the VAD and extracts all files that are mapped as DataSectionObject, ImageSectionObject or SharedCacheMap. As an investigator, however, you may want to perform a more targeted search. You can use the -r and -i flags to specify a case-insensitive regex of a filename. In the output below, you can see where the file was dumped from (DataSectionObject, ImageSectionObject or SharedCacheMap), the offset of the _FILE_OBJECT, the PID of the process whose VAD contained the file and the file path on disk:
$ python vol.py -f mebromi.raw dumpfiles -D output/ -r evt$ -i -S summary.txt
Volatility Foundation Volatility Framework 2.4
DataSectionObject 0x81ed6240   684    \Device\HarddiskVolume1\WINDOWS\system32\config\AppEvent.Evt
SharedCacheMap 0x81ed6240   684    \Device\HarddiskVolume1\WINDOWS\system32\config\AppEvent.Evt
DataSectionObject 0x8217beb0   684    \Device\HarddiskVolume1\WINDOWS\system32\config\SecEvent.Evt
DataSectionObject 0x8217bd78   684    \Device\HarddiskVolume1\WINDOWS\system32\config\SysEvent.Evt
SharedCacheMap 0x8217bd78   684    \Device\HarddiskVolume1\WINDOWS\system32\config\SysEvent.Evt

$ ls output/
file.684.0x81fc6ed0.vacb	file.684.0x82256a48.dat		file.684.0x82256e48.dat		file.None.0x82339cd8.vacb
file.684.0x8217b720.vacb	file.684.0x82256c50.dat		file.None.0x82339c70.dat
The dumped filename is in the format of:
file.[PID].[OFFSET].ext
The OFFSET is the offset of the SharedCacheMap or the _CONTROL_AREA, not the _FILE_OBJECT.
The extension (EXT) can be:
- img –
ImageSectionObject - dat -
DataSectionObject - vacb –
SharedCacheMap
You can look at the -S/--summary-file in order to map the file back to its original filename:
{"name": "\\Device\\HarddiskVolume1\\WINDOWS\\system32\\config\\AppEvent.Evt", "ofpath": "dumpfiles/file.684.0x82256e48.dat", "pid": 684,...
You can also use the parsesummary.py script to parse out the json output of the summary file. The following shows an example of using this script. In addition to the original file name, PID of the process that had the file open and size, you can see which pages were present and which pages were missing and padded with zeros in the parsed summary output:
$ python vol.py -f grrcon.img dumpfiles --summary=grrcon_summary.json -D output/
Volatility Foundation Volatility Framework 2.4

$ python parsesummary.py grrcon_summary.json |less
[snip]
File: \Device\HarddiskVolume1\Documents and Settings\administrator\NTUSER.DAT -> output/file.4.0x82245008.vacb
        PID: 4
        _FILE_OBJECT offset: 0x821cd9e8
        Type: SharedCacheMap
        Size: 262144
        Present Pages:
                Offset(V): 0xde5c0000, Length: 4096
                Offset(V): 0xde5c1000, Length: 4096
                Offset(V): 0xde5c2000, Length: 4096
                Offset(V): 0xde5c3000, Length: 4096
[snip]
        Padding:
                FileOffset: 0xde62e000 x 0x1000
                FileOffset: 0xde62f000 x 0x1000
                FileOffset: 0xde630000 x 0x1000
                FileOffset: 0xde631000 x 0x1000
                FileOffset: 0xde632000 x 0x1000
[snip]
Or you can use the -n/--name option in order to dump file the files with the original filename.
Not every file will be currently active or in the VAD, and such files will not be dumped when using the -r/--regex option. For these files you can first scan for a _FILE_OBJECT and then use the -Q/--physoffset flag to extract the file. Special NTFS files are examples of files that must be dumped specifically:
$ python vol.py -f mebromi.raw filescan |grep -i mft
Volatility Foundation Volatility Framework 2.4
0x02410900      3      0 RWD--- \Device\HarddiskVolume1\$Mft
0x02539e30      3      0 RWD--- \Device\HarddiskVolume1\$Mft
0x025ac868      3      0 RWD--- \Device\HarddiskVolume1\$MftMirr

$ python vol.py -f mebromi.raw dumpfiles -D output/ -Q 0x02539e30
Volatility Foundation Volatility Framework 2.4
DataSectionObject 0x02539e30   None   \Device\HarddiskVolume1\$Mft
SharedCacheMap 0x02539e30   None   \Device\HarddiskVolume1\$Mft
The -f/--filter option allows you to specify which view of the file you would like to dump (DataSectionObject, ImageSectionObject or SharedCacheMap). For example, if you wanted to only see the state information for an executable file, you could specify --filter=ImageSectionObject.
Windows stores information on recently unloaded drivers for debugging purposes. This gives you an alternative way to determine what happened on a system, besides the well known modules and modscan plugins.
$ python vol.py -f win7_trial_64bit.raw unloadedmodules --profile=Win7SP0x64
Volatility Foundation Volatility Framework 2.4
Name                 StartAddress       EndAddress         Time
-------------------- ------------------ ------------------ ----
dump_dumpfve.sys     0xfffff88001931000 0xfffff88001944000 2012-02-22 19:58:21
dump_atapi.sys       0xfffff88001928000 0xfffff88001931000 2012-02-22 19:58:21
dump_ataport.sys     0xfffff8800191c000 0xfffff88001928000 2012-02-22 19:58:21
crashdmp.sys         0xfffff8800190e000 0xfffff8800191c000 2012-02-22 19:58:21
To view TCP connections that were active at the time of the memory acquisition, use the connections command. This walks the singly-linked list of connection structures pointed to by a non-exported symbol in the tcpip.sys module.
This command is for x86 and x64 Windows XP and Windows 2003 Server only.
$ python vol.py -f Win2003SP2x64.vmem --profile=Win2003SP2x64 connections
Volatile Systems Volatility Framework 2.1_alpha
Offset(V)          Local Address             Remote Address               Pid
------------------ ------------------------- ------------------------- ------
0xfffffadfe6f2e2f0 172.16.237.150:1408       72.246.25.25:80             2136
0xfffffadfe72e8080 172.16.237.150:1369       64.4.11.30:80               2136
0xfffffadfe622d010 172.16.237.150:1403       74.125.229.188:80           2136
0xfffffadfe62e09e0 172.16.237.150:1352       64.4.11.20:80               2136
0xfffffadfe6f2e630 172.16.237.150:1389       209.191.122.70:80           2136
0xfffffadfe5e7a610 172.16.237.150:1419       74.125.229.187:80           2136
0xfffffadfe7321bc0 172.16.237.150:1418       74.125.229.188:80           2136
0xfffffadfe5ea3c90 172.16.237.150:1393       216.115.98.241:80           2136
0xfffffadfe72a3a80 172.16.237.150:1391       209.191.122.70:80           2136
0xfffffadfe5ed8560 172.16.237.150:1402       74.125.229.188:80           2136
Output includes the virtual offset of the _TCPT_OBJECT by default. The physical offset can be obtained with the -P switch.
To find _TCPT_OBJECT structures using pool tag scanning, use the connscan command. This can find artifacts from previous connections that have since been terminated, in addition to the active ones. In the output below, you'll notice some fields have been partially overwritten, but some of the information is still accurate. For example, the very last entry's Pid field is 0, but all other fields are still in tact. Thus, while it may find false positives sometimes, you also get the benefit of detecting as much information as possible.
This command is for x86 and x64 Windows XP and Windows 2003 Server only.
$ python vol.py -f Win2K3SP0x64.vmem --profile=Win2003SP2x64 connscan
Volatility Foundation Volatility Framework 2.4
Offset(P)  Local Address             Remote Address            Pid
---------- ------------------------- ------------------------- ------
0x0ea7a610 172.16.237.150:1419       74.125.229.187:80           2136
0x0eaa3c90 172.16.237.150:1393       216.115.98.241:80           2136
0x0eaa4480 172.16.237.150:1398       216.115.98.241:80           2136
0x0ead8560 172.16.237.150:1402       74.125.229.188:80           2136
0x0ee2d010 172.16.237.150:1403       74.125.229.188:80           2136
0x0eee09e0 172.16.237.150:1352       64.4.11.20:80               2136
0x0f9f83c0 172.16.237.150:1425       98.139.240.23:80            2136
0x0f9fe010 172.16.237.150:1394       216.115.98.241:80           2136
0x0fb2e2f0 172.16.237.150:1408       72.246.25.25:80             2136
0x0fb2e630 172.16.237.150:1389       209.191.122.70:80           2136
0x0fb72730 172.16.237.150:1424       98.139.240.23:80            2136
0x0fea3a80 172.16.237.150:1391       209.191.122.70:80           2136
0x0fee8080 172.16.237.150:1369       64.4.11.30:80               2136
0x0ff21bc0 172.16.237.150:1418       74.125.229.188:80           2136
0x1019ec90 172.16.237.150:1397       216.115.98.241:80           2136
0x179099e0 172.16.237.150:1115       66.150.117.33:80            2856
0x2cdb1bf0 172.16.237.150:139        172.16.237.1:63369             4
0x339c2c00 172.16.237.150:1138       23.45.66.43:80              1332
0x39b10010 172.16.237.150:1148       172.16.237.138:139             0
To detect listening sockets for any protocol (TCP, UDP, RAW, etc), use the sockets command. This walks a singly-linked list of socket structures which is pointed to by a non-exported symbol in the tcpip.sys module.
This command is for x86 and x64 Windows XP and Windows 2003 Server only.
$ python vol.py -f Win2K3SP0x64.vmem --profile=Win2003SP2x64 sockets
Volatility Foundation Volatility Framework 2.4
Offset(V)             PID   Port  Proto Protocol        Address         Create Time
------------------ ------ ------ ------ --------------- --------------- -----------
0xfffffadfe71bbda0    432   1025      6 TCP             0.0.0.0         2012-01-23 18:20:01
0xfffffadfe7350490    776   1028     17 UDP             0.0.0.0         2012-01-23 18:21:44
0xfffffadfe6281120    804    123     17 UDP             127.0.0.1       2012-06-25 12:40:55
0xfffffadfe7549010    432    500     17 UDP             0.0.0.0         2012-01-23 18:20:09
0xfffffadfe5ee8400      4      0     47 GRE             0.0.0.0         2012-02-24 18:09:07
0xfffffadfe606dc90      4    445      6 TCP             0.0.0.0         2012-01-23 18:19:38
0xfffffadfe6eef770      4    445     17 UDP             0.0.0.0         2012-01-23 18:19:38
0xfffffadfe7055210   2136   1321     17 UDP             127.0.0.1       2012-05-09 02:09:59
0xfffffadfe750c010      4    139      6 TCP             172.16.237.150  2012-06-25 12:40:55
0xfffffadfe745f610      4    138     17 UDP             172.16.237.150  2012-06-25 12:40:55
0xfffffadfe6096560      4    137     17 UDP             172.16.237.150  2012-06-25 12:40:55
0xfffffadfe7236da0    720    135      6 TCP             0.0.0.0         2012-01-23 18:19:51
0xfffffadfe755c5b0   2136   1419      6 TCP             0.0.0.0         2012-06-25 12:42:37
0xfffffadfe6f36510   2136   1418      6 TCP             0.0.0.0         2012-06-25 12:42:37
[snip]
Output includes the virtual offset of the _ADDRESS_OBJECT by default. The physical offset can be obtained with the -P switch.
To find _ADDRESS_OBJECT structures using pool tag scanning, use the sockscan command. As with connscan, this can pick up residual data and artifacts from previous sockets.
This command is for x86 and x64 Windows XP and Windows 2003 Server only.
$ python vol.py -f Win2K3SP0x64.vmem --profile=Win2003SP2x64 sockscan
Volatility Foundation Volatility Framework 2.4
Offset(P)             PID   Port  Proto Protocol        Address         Create Time
------------------ ------ ------ ------ --------------- --------------- -----------
0x0000000000608010    804    123     17 UDP             172.16.237.150  2012-05-08 22:17:44
0x000000000eae8400      4      0     47 GRE             0.0.0.0         2012-02-24 18:09:07
0x000000000eaf1240   2136   1403      6 TCP             0.0.0.0         2012-06-25 12:42:37
0x000000000ec6dc90      4    445      6 TCP             0.0.0.0         2012-01-23 18:19:38
0x000000000ec96560      4    137     17 UDP             172.16.237.150  2012-06-25 12:40:55
0x000000000ecf7d20   2136   1408      6 TCP             0.0.0.0         2012-06-25 12:42:37
0x000000000ed5a010   2136   1352      6 TCP             0.0.0.0         2012-06-25 12:42:18
0x000000000ed84ca0    804    123     17 UDP             172.16.237.150  2012-06-25 12:40:55
0x000000000ee2d380   2136   1393      6 TCP             0.0.0.0         2012-06-25 12:42:37
0x000000000ee81120    804    123     17 UDP             127.0.0.1       2012-06-25 12:40:55
0x000000000eeda8c0    776   1363     17 UDP             0.0.0.0         2012-06-25 12:42:20
0x000000000f0be1a0   2136   1402      6 TCP             0.0.0.0         2012-06-25 12:42:37
0x000000000f0d0890      4   1133      6 TCP             0.0.0.0         2012-02-24 18:09:07
[snip]
To scan for network artifacts in 32- and 64-bit Windows Vista, Windows 2008 Server and Windows 7 memory dumps, use the netscan command. This finds TCP endpoints, TCP listeners, UDP endpoints, and UDP listeners. It distinguishes between IPv4 and IPv6, prints the local and remote IP (if applicable), the local and remote port (if applicable), the time when the socket was bound or when the connection was established, and the current state (for TCP connections only). For more information, see http://mnin.blogspot.com/2011/03/volatilitys-new-netscan-module.html Volatility's New Netscan Module.
Please note the following:
- The netscan command uses pool tag scanning
- There are at least 2 alternate ways to enumerate connections and sockets on Vista+ operating systems. One of them is using partitions and dynamic hash tables, which is how the netstat.exe utility on Windows systems works. The other involves bitmaps and port pools.
$ python vol.py -f ~/Desktop/win7_trial_64bit.raw --profile=Win7SP0x64 netscan
Volatility Foundation Volatility Framework 2.4
Offset(P)  Proto    Local Address                  Foreign Address      State            Pid      Owner          Created
0xf882a30  TCPv4    0.0.0.0:135                    0.0.0.0:0            LISTENING        628      svchost.exe
0xfc13770  TCPv4    0.0.0.0:49154                  0.0.0.0:0            LISTENING        916      svchost.exe
0xfdda1e0  TCPv4    0.0.0.0:49154                  0.0.0.0:0            LISTENING        916      svchost.exe
0xfdda1e0  TCPv6    :::49154                       :::0                 LISTENING        916      svchost.exe
0x1121b7b0 TCPv4    0.0.0.0:135                    0.0.0.0:0            LISTENING        628      svchost.exe
0x1121b7b0 TCPv6    :::135                         :::0                 LISTENING        628      svchost.exe
0x11431360 TCPv4    0.0.0.0:49152                  0.0.0.0:0            LISTENING        332      wininit.exe
0x11431360 TCPv6    :::49152                       :::0                 LISTENING        332      wininit.exe
[snip]
0x17de8980 TCPv6    :::49153                       :::0                 LISTENING        444      lsass.exe
0x17f35240 TCPv4    0.0.0.0:49155                  0.0.0.0:0            LISTENING        880      svchost.exe
0x17f362b0 TCPv4    0.0.0.0:49155                  0.0.0.0:0            LISTENING        880      svchost.exe
0x17f362b0 TCPv6    :::49155                       :::0                 LISTENING        880      svchost.exe
0xfd96570  TCPv4    -:0                            232.9.125.0:0        CLOSED           1        ?C?
0x17236010 TCPv4    -:49227                        184.26.31.55:80      CLOSED           2820     iexplore.exe
0x1725d010 TCPv4    -:49359                        93.184.220.20:80     CLOSED           2820     iexplore.exe
0x17270530 TCPv4    10.0.2.15:49363                173.194.35.38:80     ESTABLISHED      2820     iexplore.exe
0x17285010 TCPv4    -:49341                        82.165.218.111:80    CLOSED           2820     iexplore.exe
0x17288a90 TCPv4    10.0.2.15:49254                74.125.31.157:80     CLOSE_WAIT       2820     iexplore.exe
0x1728f6b0 TCPv4    10.0.2.15:49171                204.245.34.130:80    ESTABLISHED      2820     iexplore.exe
0x17291ba0 TCPv4    10.0.2.15:49347                173.194.35.36:80     CLOSE_WAIT       2820     iexplore.exe
[snip]
0x17854010 TCPv4    -:49168                        157.55.15.32:80      CLOSED           2820     iexplore.exe
0x178a2a20 TCPv4    -:0                            88.183.123.0:0       CLOSED           504      svchost.exe
0x178f5b00 TCPv4    10.0.2.15:49362                173.194.35.38:80     CLOSE_WAIT       2820     iexplore.exe
0x17922910 TCPv4    -:49262                        184.26.31.55:80      CLOSED           2820     iexplore.exe
0x17a9d860 TCPv4    10.0.2.15:49221                204.245.34.130:80    ESTABLISHED      2820     iexplore.exe
0x17ac84d0 TCPv4    10.0.2.15:49241                74.125.31.157:80     CLOSE_WAIT       2820     iexplore.exe
0x17b9acf0 TCPv4    10.0.2.15:49319                74.125.127.148:80    CLOSE_WAIT       2820     iexplore.exe
0x10f38d70 UDPv4    10.0.2.15:1900                 *:*                                   1736     svchost.exe    2012-02-22 20:04:12
0x173b3dc0 UDPv4    0.0.0.0:59362                  *:*                                   1736     svchost.exe    2012-02-22 20:02:27
0x173b3dc0 UDPv6    :::59362                       *:*                                   1736     svchost.exe    2012-02-22 20:02:27
0x173b4cf0 UDPv4    0.0.0.0:3702                   *:*                                   1736     svchost.exe    2012-02-22 20:02:27
0x173b4cf0 UDPv6    :::3702                        *:*                                   1736     svchost.exe    2012-02-22 20:02:27
[snip]
Volatility is the only memory forensics framework with the ability to carve registry data. For more information, see BDG's Memory Registry Tools and Registry Code Updates.
To find the physical addresses of CMHIVEs (registry hives) in memory, use the hivescan command. For more information, see BDG's Enumerating Registry Hives.
This plugin isn't generally useful by itself. Its meant to be inherited by other plugins (such as hivelist below) that build on and interpret the information found in CMHIVEs.
$python vol.py -f ~/Desktop/win7_trial_64bit.raw --profile=Win7SP0x64 hivescan
Volatility Foundation Volatility Framework 2.4
Offset(P)
------------------
0x0000000008c95010
0x000000000aa1a010
0x000000000acf9010
0x000000000b1a9010
0x000000000c2b4010
0x000000000cd20010
0x000000000da51010
[snip]
To locate the virtual addresses of registry hives in memory, and the full paths to the corresponding hive on disk, use the hivelist command. If you want to print values from a certain hive, run this command first so you can see the address of the hives.
$ python vol.py -f ~/Desktop/win7_trial_64bit.raw --profile=Win7SP0x64 hivelist
Volatility Foundation Volatility Framework 2.4
Virtual            Physical           Name
------------------ ------------------ ----
0xfffff8a001053010 0x000000000b1a9010 \??\C:\System Volume Information\Syscache.hve
0xfffff8a0016a7420 0x0000000012329420 \REGISTRY\MACHINE\SAM
0xfffff8a0017462a0 0x00000000101822a0 \??\C:\Windows\ServiceProfiles\NetworkService\NTUSER.DAT
0xfffff8a001abe420 0x000000000eae0420 \??\C:\Windows\ServiceProfiles\LocalService\NTUSER.DAT
0xfffff8a002ccf010 0x0000000014659010 \??\C:\Users\testing\AppData\Local\Microsoft\Windows\UsrClass.dat
0xfffff80002b53b10 0x000000000a441b10 [no name]
0xfffff8a00000d010 0x000000000ddc6010 [no name]
0xfffff8a000022010 0x000000000da51010 \REGISTRY\MACHINE\SYSTEM
0xfffff8a00005c010 0x000000000dacd010 \REGISTRY\MACHINE\HARDWARE
0xfffff8a00021d010 0x000000000cd20010 \SystemRoot\System32\Config\SECURITY
0xfffff8a0009f1010 0x000000000aa1a010 \Device\HarddiskVolume1\Boot\BCD
0xfffff8a000a15010 0x000000000acf9010 \SystemRoot\System32\Config\SOFTWARE
0xfffff8a000ce5010 0x0000000008c95010 \SystemRoot\System32\Config\DEFAULT
0xfffff8a000f95010 0x000000000c2b4010 \??\C:\Users\testing\ntuser.dat
To display the subkeys, values, data, and data types contained within a specified registry key, use the printkey command. By default, printkey will search all hives and print the key information (if found) for the requested key. Therefore, if the key is located in more than one hive, the information for the key will be printed for each hive that contains it.
Say you want to traverse into the HKEY_LOCAL_MACHINE\Microsoft\Security Center\Svc key. You can do that in the following manner. Note: if you're running Volatility on Windows, enclose the key in double quotes (see issue 166).
$ python vol.py -f ~/Desktop/win7_trial_64bit.raw --profile=Win7SP0x64 printkey -K "Microsoft\Security Center\Svc"
Volatility Foundation Volatility Framework 2.4
Legend: (S) = Stable   (V) = Volatile

----------------------------
Registry: \SystemRoot\System32\Config\SOFTWARE
Key name: Svc (S)
Last updated: 2012-02-22 20:04:44

Subkeys:
  (V) Vol

Values:
REG_QWORD     VistaSp1        : (S) 128920218544262440
REG_DWORD     AntiSpywareOverride : (S) 0
REG_DWORD     ConfigMask      : (S) 4361
Here you can see how the output appears when multiple hives (DEFAULT and ntuser.dat) contain the same key "Software\Microsoft\Windows NT\CurrentVersion".
$ python vol.py -f ~/Desktop/win7_trial_64bit.raw --profile=Win7SP0x64 printkey -K "Software\Microsoft\Windows NT\CurrentVersion"
Volatility Foundation Volatility Framework 2.4
Legend: (S) = Stable   (V) = Volatile

----------------------------
Registry: \SystemRoot\System32\Config\DEFAULT
Key name: CurrentVersion (S)
Last updated: 2009-07-14 04:53:31

Subkeys:
  (S) Devices
  (S) PrinterPorts

Values:
----------------------------
Registry: \??\C:\Users\testing\ntuser.dat
Key name: CurrentVersion (S)
Last updated: 2012-02-22 11:26:13

Subkeys:
  (S) Devices
  (S) EFS
  (S) MsiCorruptedFileRecovery
  (S) Network
  (S) PeerNet
  (S) PrinterPorts
  (S) Windows
  (S) Winlogon

[snip]
If you want to limit your search to a specific hive, printkey also accepts a virtual address to the hive. For example, to see the contents of HKEY_LOCAL_MACHINE, use the command below. Note: the offset is taken from the previous hivelist output.
$ python vol.py -f ~/Desktop/win7_trial_64bit.raw --profile=Win7SP0x64 printkey -o 0xfffff8a000a15010
Volatility Foundation Volatility Framework 2.4
Legend: (S) = Stable   (V) = Volatile

----------------------------
Registry: User Specified
Key name: CMI-CreateHive{199DAFC2-6F16-4946-BF90-5A3FC3A60902} (S)
Last updated: 2009-07-14 07:13:38

Subkeys:
  (S) ATI Technologies
  (S) Classes
  (S) Clients
  (S) Intel
  (S) Microsoft
  (S) ODBC
  (S) Policies
  (S) RegisteredApplications
  (S) Sonic
  (S) Wow6432Node
To recursively list all subkeys in a hive, use the hivedump command and pass it the virtual address to the desired hive.
$ python vol.py -f ~/Desktop/win7_trial_64bit.raw --profile=Win7SP0x64 hivedump -o 0xfffff8a000a15010
Volatility Foundation Volatility Framework 2.4
Last Written         Key
2009-07-14 07:13:38  \CMI-CreateHive{199DAFC2-6F16-4946-BF90-5A3FC3A60902}
2009-07-14 04:48:57  \CMI-CreateHive{199DAFC2-6F16-4946-BF90-5A3FC3A60902}\ATI Technologies
2009-07-14 04:48:57  \CMI-CreateHive{199DAFC2-6F16-4946-BF90-5A3FC3A60902}\ATI Technologies\Install
2009-07-14 04:48:57  \CMI-CreateHive{199DAFC2-6F16-4946-BF90-5A3FC3A60902}\ATI Technologies\Install\South Bridge
2009-07-14 04:48:57  \CMI-CreateHive{199DAFC2-6F16-4946-BF90-5A3FC3A60902}\ATI Technologies\Install\South Bridge\ATI_AHCI_RAID
2009-07-14 07:13:39  \CMI-CreateHive{199DAFC2-6F16-4946-BF90-5A3FC3A60902}\Classes
2009-07-14 04:53:38  \CMI-CreateHive{199DAFC2-6F16-4946-BF90-5A3FC3A60902}\Classes\*
2009-07-14 04:53:38  \CMI-CreateHive{199DAFC2-6F16-4946-BF90-5A3FC3A60902}\Classes\*\OpenWithList
2009-07-14 04:53:38  \CMI-CreateHive{199DAFC2-6F16-4946-BF90-5A3FC3A60902}\Classes\*\OpenWithList\Excel.exe
2009-07-14 04:53:38  \CMI-CreateHive{199DAFC2-6F16-4946-BF90-5A3FC3A60902}\Classes\*\OpenWithList\IExplore.exe
[snip]
To extract and decrypt cached domain credentials stored in the registry, use the hashdump command. For more information, see BDG's Cached Domain Credentials and SANS Forensics 2009 - Memory Forensics and Registry Analysis.
To use hashdump, pass the virtual address of the SYSTEM hive as -y and the virtual address of the SAM hive as -s, like this:
$ python vol.py hashdump -f image.dd -y 0xe1035b60 -s 0xe165cb60
Administrator:500:08f3a52bdd35f179c81667e9d738c5d9:ed88cccbc08d1c18bcded317112555f4:::
Guest:501:aad3b435b51404eeaad3b435b51404ee:31d6cfe0d16ae931b73c59d7e0c089c0:::
HelpAssistant:1000:ddd4c9c883a8ecb2078f88d729ba2e67:e78d693bc40f92a534197dc1d3a6d34f:::
SUPPORT_388945a0:1002:aad3b435b51404eeaad3b435b51404ee:8bfd47482583168a0ae5ab020e1186a9:::
phoenix:1003:07b8418e83fad948aad3b435b51404ee:53905140b80b6d8cbe1ab5953f7c1c51:::
ASPNET:1004:2b5f618079400df84f9346ce3e830467:aef73a8bb65a0f01d9470fadc55a411c:::
S----:1006:aad3b435b51404eeaad3b435b51404ee:31d6cfe0d16ae931b73c59d7e0c089c0:::
Hashes can now be cracked using John the Ripper, rainbow tables, etc.
It is possible that a registry key is not available in memory. When this happens, you may see the following error:
"ERROR : volatility.plugins.registry.lsadump: Unable to read hashes from registry"
You can try to see if the correct keys are available: "CurrentControlSet\Control\lsa" from SYSTEM and "SAM\Domains\Account" from SAM. First you need to get the "CurrentControlSet", for this we can use volshell (replace [REGISTRY ADDRESS](SYSTEM) below with the offset you get from hivelist), for example:
$ python vol.py -f XPSP3.vmem --profile=WinXPSP3x86 volshell
Volatility Foundation Volatility Framework 2.4
Current context: process System, pid=4, ppid=0 DTB=0x319000
Welcome to volshell Current memory image is:
file:///XPSP3.vmem
To get help, type 'hh()'
>>> import volatility.win32.hashdump as h
>>> import volatility.win32.hive as hive
>>> addr_space = utils.load_as(self._config)
>>> sysaddr = hive.HiveAddressSpace(addr_space, self._config, [SYSTEM REGISTRY ADDRESS])
>>> print h.find_control_set(sysaddr)
1
>>> ^D
Then you can use the printkey plugin to make sure the keys and their data are there. Since the "CurrentControlSet" is 1 in our previous example, we use "ControlSet001" in the first command:
$ python vol.py -f XPSP3.vmem --profile=WinXPSP3x86 printkey -K "ControlSet001\Control\lsa"

$ python vol.py -f XPSP3.vmem --profile=WinXPSP3x86 printkey -K "SAM\Domains\Account"
If the key is missing you should see an error message:
"The requested key could not be found in the hive(s) searched"
To dump LSA secrets from the registry, use the lsadump command. This exposes information such as the default password (for systems with autologin enabled), the RDP public key, and credentials used by DPAPI.
For more information, see BDG's Decrypting LSA Secrets.
$ python vol.py -f laqma.vmem lsadump
Volatility Foundation Volatility Framework 2.4
L$RTMTIMEBOMB_1320153D-8DA3-4e8e-B27B-0D888223A588

0000   00 92 8D 60 01 FF C8 01                            ...`....

_SC_Dnscache

L$HYDRAENCKEY_28ada6da-d622-11d1-9cb9-00c04fb16e75

0000   52 53 41 32 48 00 00 00 00 02 00 00 3F 00 00 00    RSA2H.......?...
0010   01 00 01 00 37 CE 0C C0 EF EC 13 C8 A4 C5 BC B8    ....7...........
0020   AA F5 1A 7C 50 95 A4 E9 3B BA 41 C8 53 D7 CE C6    ...|P...;.A.S...
0030   CB A0 6A 46 7C 70 F3 21 17 1C FB 79 5C C1 83 68    ..jF|p....y...h
0040   91 E5 62 5E 2C AC 21 1E 79 07 A9 21 BB F0 74 E8    ..b^,..y....t.
0050   85 66 F4 C4 00 00 00 00 00 00 00 00 F9 D7 AD 5C    .f..............
0060   B4 7C FB F6 88 89 9D 2E 91 F2 60 07 10 42 CA 5A    .|........`..B.Z
0070   FC F0 D1 00 0F 86 29 B5 2E 1E 8C E0 00 00 00 00    ......).........
0080   AF 43 30 5F 0D 0E 55 04 57 F9 0D 70 4A C8 36 01    .C0_..U.W..pJ.6.
0090   C2 63 45 59 27 62 B5 77 59 84 B7 65 8E DB 8A E0    .cEY'b.wY..e....
00A0   00 00 00 00 89 19 5E D8 CB 0E 03 39 E2 52 04 37    ......^....9.R.7
00B0   20 DC 03 C8 47 B5 2A B3 9C 01 65 15 FF 0F FF 8F     ...G.*...e.....
00C0   17 9F C1 47 00 00 00 00 1B AC BF 62 4E 81 D6 2A    ...G.......bN..*
00D0   32 98 36 3A 11 88 2D 99 3A EA 59 DE 4D 45 2B 9E    2.6:..-.:.Y.ME+.
00E0   74 15 14 E1 F2 B5 B2 80 00 00 00 00 75 BD A0 36    t...........u..6
00F0   20 AD 29 0E 88 E0 FD 5B AD 67 CA 88 FC 85 B9 82     .)....[.g......
0100   94 15 33 1A F1 65 45 D1 CA F9 D8 4C 00 00 00 00    ..3..eE....L....
0110   71 F0 0B 11 F2 F1 AA C5 0C 22 44 06 E1 38 6C ED    q........"D..8l.
0120   6E 38 51 18 E8 44 5F AD C2 CE 0A 0A 1E 8C 68 4F    n8Q..D_.......hO
0130   4D 91 69 07 DE AA 1A EC E6 36 2A 9C 9C B6 49 1F    M.i......6*...I.
0140   B3 DD 89 18 52 7C F8 96 4F AF 05 29 DF 17 D8 48    ....R|..O..)...H
0150   00 00 00 00 00 00 00 00 00 00 00 00 00 00 00 00    ................
0160   00 00 00 00 00 00 00 00 00 00 00 00 00 00 00 00    ................
0170   00 00 00 00 00 00 00 00 00 00 00 00                ............

DPAPI_SYSTEM

0000   01 00 00 00 24 04 D6 B0 DA D1 3C 40 BB EE EC 89    ....$.....<@....
0010   B4 BB 90 5B 9A BF 60 7D 3E 96 72 CD 9A F6 F8 BE    ...[..`}>.r.....
0020   D3 91 5C FA A5 8B E6 B4 81 0D B6 D4                ............
Possible items are:
- $MACHINE.ACC: Domain authentication Microsoft.
- DefaultPassword: Password used to log on to Windows when auto-login is enabled.
- NL$KM: Secret key used to encrypt cached domain passwords Decrypting LSA Secrets.
- L$RTMTIMEBOMB_*: Timestamp giving the date when an unactivated copy of Windows will stop working.
- L$HYDRAENCKEY_*: Private key used for Remote Desktop Protocol (RDP). If you also have a packet capture from a system that was attacked via RDP, you can extract the client’s public key from the packet capture and the server’s private key from memory; then decrypt the traffic.
To get the UserAssist keys from a sample you can use the userassist plugin. For more information see Gleeda's Volatility UserAssist plugin post.
$ python vol.py -f win7.vmem --profile=Win7SP0x86 userassist
Volatility Foundation Volatility Framework 2.4
----------------------------
Registry: \??\C:\Users\admin\ntuser.dat
Key name: Count
Last updated: 2010-07-06 22:40:25

Subkeys:

Values:
REG_BINARY    Microsoft.Windows.GettingStarted :
Count:          14
Focus Count:    21
Time Focused:   0:07:00.500000
Last updated:   2010-03-09 19:49:20

0000   00 00 00 00 0E 00 00 00 15 00 00 00 A0 68 06 00    .............h..
0010   00 00 80 BF 00 00 80 BF 00 00 80 BF 00 00 80 BF    ................
0020   00 00 80 BF 00 00 80 BF 00 00 80 BF 00 00 80 BF    ................
0030   00 00 80 BF 00 00 80 BF FF FF FF FF EC FE 7B 9C    ..............{.
0040   C1 BF CA 01 00 00 00 00                            ........

REG_BINARY    UEME_CTLSESSION :
Count:          187
Focus Count:    1205
Time Focused:   6:25:06.216000
Last updated:   1970-01-01 00:00:00

[snip]

REG_BINARY    %windir%\system32\calc.exe :
Count:          12
Focus Count:    17
Time Focused:   0:05:40.500000
Last updated:   2010-03-09 19:49:20

0000   00 00 00 00 0C 00 00 00 11 00 00 00 20 30 05 00    ............ 0..
0010   00 00 80 BF 00 00 80 BF 00 00 80 BF 00 00 80 BF    ................
0020   00 00 80 BF 00 00 80 BF 00 00 80 BF 00 00 80 BF    ................
0030   00 00 80 BF 00 00 80 BF FF FF FF FF EC FE 7B 9C    ..............{.
0040   C1 BF CA 01 00 00 00 00                            ........
                          ........

REG_BINARY    Z:\vmware-share\apps\odbg110\OLLYDBG.EXE :
Count:          11
Focus Count:    266
Time Focused:   1:19:58.045000
Last updated:   2010-03-18 01:56:31

0000   00 00 00 00 0B 00 00 00 0A 01 00 00 69 34 49 00    ............i4I.
0010   00 00 80 BF 00 00 80 BF 00 00 80 BF 00 00 80 BF    ................
0020   00 00 80 BF 00 00 80 BF 00 00 80 BF 00 00 80 BF    ................
0030   00 00 80 BF 00 00 80 BF FF FF FF FF 70 3B CB 3A    ............p;.:
0040   3E C6 CA 01 00 00 00 00                            >.......
[snip]
This plugin parses and prints Shellbag (pdf) information obtained from the registry. For more information see Shellbags in Memory, SetRegTime, and TrueCrypt Volumes. There are two options for output: verbose (default) and bodyfile format.
$ python vol.py -f win7.vmem --profile=Win7SP1x86 shellbags
Volatility Foundation Volatility Framework 2.4
Scanning for registries....
Gathering shellbag items and building path tree...
***************************************************************************
Registry: \??\C:\Users\user\ntuser.dat
Key: Software\Microsoft\Windows\Shell\Bags\1\Desktop
Last updated: 2011-10-20 15:24:46
Value                     File Name      Modified Date        Create Date          Access Date          File Attr                 Unicode Name
------------------------- -------------- -------------------- -------------------- -------------------- ------------------------- ------------
ItemPos1176x882x96(1)     ADOBER~1.LNK   2011-10-20 15:20:04  2011-10-20 15:20:04  2011-10-20 15:20:04  ARC                       Adobe Reader X.lnk
ItemPos1176x882x96(1)     ENCASE~1.LNK   2011-05-15 23:02:26  2011-05-15 23:02:26  2011-05-15 23:02:26  ARC                       EnCase v6.18.lnk
ItemPos1176x882x96(1)     VMWARE~1.LNK   2011-10-20 15:13:06  2011-05-15 23:09:08  2011-10-20 15:13:06  ARC                       VMware Shared Folders.lnk
ItemPos1176x882x96(1)     EF_SET~1.EXE   2010-12-28 15:47:32  2011-05-15 23:01:10  2011-05-15 23:01:10  ARC, NI                   ef_setup_618_english.exe
ItemPos1366x768x96(1)     ADOBER~1.LNK   2011-10-20 15:20:04  2011-10-20 15:20:04  2011-10-20 15:20:04  ARC                       Adobe Reader X.lnk
ItemPos1366x768x96(1)     ENCASE~1.LNK   2011-05-15 23:02:26  2011-05-15 23:02:26  2011-05-15 23:02:26  ARC                       EnCase v6.18.lnk
ItemPos1366x768x96(1)     EF_SET~1.EXE   2010-12-28 15:47:32  2011-05-15 23:01:10  2011-05-15 23:01:10  ARC, NI                   ef_setup_618_english.exe
ItemPos1366x768x96(1)     VMWARE~1.LNK   2011-10-20 15:24:22  2011-05-15 23:09:08  2011-10-20 15:24:22  ARC                       VMware Shared Folders.lnk
ItemPos1640x834x96(1)     EF_SET~1.EXE   2010-12-28 15:47:32  2011-05-15 23:01:10  2011-05-15 23:01:10  ARC, NI                   ef_setup_618_english.exe
ItemPos1640x834x96(1)     ENCASE~1.LNK   2011-05-15 23:02:26  2011-05-15 23:02:26  2011-05-15 23:02:26  ARC                       EnCase v6.18.lnk
ItemPos1640x834x96(1)     VMWARE~1.LNK   2011-05-15 23:09:08  2011-05-15 23:09:08  2011-05-15 23:09:08  ARC                       VMware Shared Folders.lnk
***************************************************************************

***************************************************************************
Registry: \??\C:\Users\user\AppData\Local\Microsoft\Windows\UsrClass.dat
Key: Local Settings\Software\Microsoft\Windows\Shell\BagMRU
Last updated: 2011-10-20 15:14:21
Value   Mru   Entry Type     GUID                                     GUID Description     Folder IDs
------- ----- -------------- ---------------------------------------- -------------------- ----------
1       2     Folder Entry   031e4825-7b94-4dc3-b131-e946b44c8dd5     Libraries            EXPLORER, LIBRARIES
0       1     Folder Entry   20d04fe0-3aea-1069-a2d8-08002b30309d     My Computer          EXPLORER, MY_COMPUTER
2       0     Folder Entry   59031a47-3f72-44a7-89c5-5595fe6b30ee     Users                EXPLORER, USERS
***************************************************************************

***************************************************************************
Registry: \??\C:\Users\user\AppData\Local\Microsoft\Windows\UsrClass.dat
Key: Local Settings\Software\Microsoft\Windows\Shell\BagMRU\0
Last updated: 2011-05-15 23:10:01
Value   Mru   Entry Type     Path
------- ----- -------------- ----
1       0     Volume Name    Z:\
0       1     Volume Name    C:\
***************************************************************************
[snip]

***************************************************************************
Registry: \??\C:\Users\user\AppData\Local\Microsoft\Windows\UsrClass.dat
Key: Local Settings\Software\Microsoft\Windows\Shell\BagMRU\0\0\0\0
Last updated: 2011-05-15 23:03:22
Value   Mru   File Name      Modified Date        Create Date          Access Date          File Attr                 Path
------- ----- -------------- -------------------- -------------------- -------------------- ------------------------- ----
0       0     AppData        2011-05-15 22:57:52  2011-05-15 22:57:52  2011-05-15 22:57:52  HID, NI, DIR              C:\Users\user\AppData
***************************************************************************
[snip]
Another option is to use the --output=body option for TSK 3.x bodyfile format. You can use this output option when you want to combine output from timeliner, mftparser and timeliner. You can also include a machine identifier in the bodyfile header with the --machine flag (this is useful when combining timelines from multiple machines). Only ITEMPOS and FILE_ENTRY items are output with the bodyfile format:
$ python vol.py -f win7.vmem --profile=Win7SP1x86 shellbags --output=body
Volatility Foundation Volatility Framework 2.4
Scanning for registries....
Gathering shellbag items and building path tree...
0|[SHELLBAGS ITEMPOS] Name: Adobe Reader X.lnk/Attrs: ARC/FullPath: Adobe Reader X.lnk/Registry: \??\C:\Users\user\ntuser.dat /Key: Software\Microsoft\Windows\Shell\Bags\1\Desktop/LW: 2011-10-20 15:24:46 UTC+0000|0|---------------|0|0|0|1319124004|1319124004|1319124004|1319124004
0|[SHELLBAGS ITEMPOS] Name: EnCase v6.18.lnk/Attrs: ARC/FullPath: EnCase v6.18.lnk/Registry: \??\C:\Users\user\ntuser.dat /Key: Software\Microsoft\Windows\Shell\Bags\1\Desktop/LW: 2011-10-20 15:24:46 UTC+0000|0|---------------|0|0|0|1305500546|1305500546|1305500546|1305500546
0|[SHELLBAGS ITEMPOS] Name: VMware Shared Folders.lnk/Attrs: ARC/FullPath: VMware Shared Folders.lnk/Registry: \??\C:\Users\user\ntuser.dat /Key: Software\Microsoft\Windows\Shell\Bags\1\Desktop/LW: 2011-10-20 15:24:46 UTC+0000|0|---------------|0|0|0|1319123586|1319123586|1305500948|1305500948
[snip]
0|[SHELLBAGS FILE_ENTRY] Name: Program Files/Attrs: RO, DIR/FullPath: C:\Program Files/Registry: \??\C:\Users\user\AppData\Local\Microsoft\Windows\UsrClass.dat /Key: Local Settings\Software\Microsoft\Windows\Shell\BagMRU\0\0/LW: 2011-05-15 23:03:35 UTC+0000|0|---------------|0|0|0|1305500504|1305500504|1247539026|1247539026
0|[SHELLBAGS FILE_ENTRY] Name: Users/Attrs: RO, DIR/FullPath: C:\Users/Registry: \??\C:\Users\user\AppData\Local\Microsoft\Windows\UsrClass.dat /Key: Local Settings\Software\Microsoft\Windows\Shell\BagMRU\0\0/LW: 2011-05-15 23:03:35 UTC+0000|0|---------------|0|0|0|1305500270|1305500270|1247539026|1247539026
[snip]
This plugin parses the Application Compatibility Shim Cache registry key.
$ python vol.py -f win7.vmem --profile=Win7SP1x86 shimcache
Volatility Foundation Volatility Framework 2.4
Last Modified                  Path
------------------------------ ----
2009-07-14 01:14:22 UTC+0000   \??\C:\Windows\system32\LogonUI.exe
2009-07-14 01:14:18 UTC+0000   \??\C:\Windows\system32\DllHost.exe
2009-07-14 01:16:03 UTC+0000   \??\C:\Windows\System32\networkexplorer.dll
2009-07-14 01:14:31 UTC+0000   \??\C:\WINDOWS\SYSTEM32\RUNDLL32.EXE
2011-03-22 18:18:16 UTC+0000   \??\C:\Program Files\VMware\VMware Tools\TPAutoConnect.exe
2009-07-14 01:14:25 UTC+0000   \??\C:\Windows\System32\msdtc.exe
2009-07-14 01:15:22 UTC+0000   \??\C:\Windows\System32\gameux.dll
2011-08-12 00:00:18 UTC+0000   \??\C:\Program Files\Common Files\VMware\Drivers\vss\comreg.exe
2010-08-02 20:42:26 UTC+0000   \??\C:\Program Files\VMware\VMware Tools\TPAutoConnSvc.exe
2009-07-14 01:14:27 UTC+0000   \??\C:\Windows\system32\net1.exe
2009-07-14 01:14:27 UTC+0000   \??\C:\Windows\System32\net.exe
2011-08-12 00:06:50 UTC+0000   \??\C:\Program Files\VMware\VMware Tools\vmtoolsd.exe
2009-07-14 01:14:45 UTC+0000   \??\C:\Windows\system32\WFS.exe
[snip]
The getservicesids command calculates the SIDs for services on a machine and outputs them in Python dictionary format for future use.
The service names are taken from the registry ("SYSTEM\CurrentControlSet\Services"). For more information on how these SIDs are calculated, see Timeliner Release Documentation (pdf). Example output can be seen below:
$ python vol.py -f WinXPSP1x64.vmem --profile=WinXPSP2x64 getservicesids
Volatility Foundation Volatility Framework 2.4
servicesids = {
    'S-1-5-80-2675092186-3691566608-1139246469-1504068187-1286574349':
'Abiosdsk',
    'S-1-5-80-850610371-2162948594-2204246734-1395993891-583065928': 'ACPIEC',
    'S-1-5-80-2838020983-819055183-730598559-323496739-448665943': 'adpu160m',
    'S-1-5-80-3218321610-3296847771-3570773115-868698368-3117473630': 'aec',
    'S-1-5-80-1344778701-2960353790-662938617-678076498-4183748354': 'aic78u2',
    'S-1-5-80-1076555770-1261388817-3553637611-899283093-3303637635': 'Alerter',
    'S-1-5-80-1587539839-2488332913-1287008632-3751426284-4220573165': 'AliIde',
    'S-1-5-80-4100430975-1934021090-490597466-3817433801-2954987127': 'AmdIde',
    'S-1-5-80-258649362-1997344556-1754272750-1450123204-3407402222': 'Atdisk',

[snip]
In order to save output to a file, use the --output-file option.
The dumpregistry plugin allows you to dump a registry hive to disk. It works on all supported Windows versions (Windows XP-8.1). By default the plugin will dump all registry files (including virtual registries like HARDWARE) found to disk, however you may specify the virtual offset for a specific hive in order to only dump one registry at a time. One caveat about using this plugin (or the dumpfiles plugin) is that there may be holes in the dumped registry file, so offline registry tools may crash if they are not made robustly to handle "corrupt" files. These holes are denoted in the text output with lines like Physical layer returned None for index 2000, filling with NULL. Example output is shown below:
$ python vol.py -f voltest.dmp --profile=Win7SP1x86 dumpregistry -D output
**************************************************
Writing out registry: registry.0x888101e0.no_name.reg

**************************************************
**************************************************
Writing out registry: registry.0x8cec09d0.ntuserdat.reg

Physical layer returned None for index 9000, filling with NULL
Physical layer returned None for index a000, filling with NULL
Physical layer returned None for index b000, filling with NULL
[snip]
**************************************************
Writing out registry: registry.0x8883c7d0.HARDWARE.reg

Physical layer returned None for index 2000, filling with NULL
Physical layer returned None for index 3000, filling with NULL
Physical layer returned None for index 4000, filling with NULL
[snip]
**************************************************
Writing out registry: registry.0x88c9c008.SAM.reg

**************************************************
**************************************************
Writing out registry: registry.0x8a5449d0.NTUSERDAT.reg

**************************************************
[snip]
$ file output/*
output/registry.0x888101e0.no_name.reg:     MS Windows registry file, NT/2000 or above
output/registry.0x8881c008.SYSTEM.reg:      MS Windows registry file, NT/2000 or above
output/registry.0x8883c7d0.HARDWARE.reg:    data
output/registry.0x888c14e8.DEFAULT.reg:     MS Windows registry file, NT/2000 or above
output/registry.0x88c3b898.SECURITY.reg:    MS Windows registry file, NT/2000 or above
output/registry.0x88c9c008.SAM.reg:         MS Windows registry file, NT/2000 or above
output/registry.0x8a4c2008.NTUSERDAT.reg:   MS Windows registry file, NT/2000 or above
output/registry.0x8a5449d0.NTUSERDAT.reg:   MS Windows registry file, NT/2000 or above
output/registry.0x8c7e7008.BCD.reg:         MS Windows registry file, NT/2000 or above
output/registry.0x8cec09d0.ntuserdat.reg:   MS Windows registry file, NT/2000 or above
output/registry.0x8d432008.SOFTWARE.reg:    MS Windows registry file, NT/2000 or above
output/registry.0x945229d0.UsrClassdat.reg: MS Windows registry file, NT/2000 or above
output/registry.0xa019c9d0.Syscachehve.reg: MS Windows registry file, NT/2000 or above
Notice that the HARDWARE registry has "Data" as the type. This is because the first few cells of the registry are zeroed out. If you examine the registry with a hex editor, you will see valid keys and values:
$ xxd output/registry.0x8883c7d0.HARDWARE.reg |grep -v "0000 0000 0000 0000 0000 0000 0000 0000" |less
0001000: 6862 696e 0000 0000 0010 0000 0000 0000  hbin............
0001020: a8ff ffff 6e6b 2c00 c1be 7203 3eba cf01  ....nk,...r.>...
0001030: 0000 0000 d002 0000 0300 0000 0100 0000  ................
0001040: 9018 0000 2801 0080 0000 0000 ffff ffff  ....(...........
0001050: 7800 0000 ffff ffff 1600 0000 0000 0000  x...............
0001060: 0000 0000 0000 0000 0000 0000 0800 0000  ................
0001070: 4841 5244 5741 5245 58ff ffff 736b 0000  HARDWAREX...sk..
0001080: 7800 0000 7800 0000 2800 0000 8c00 0000  x...x...(.......
0001090: 0100 0480 7000 0000 8000 0000 0000 0000  ....p...........
00010a0: 1400 0000 0200 5c00 0400 0000 0002 1400  ......\.........
00010b0: 3f00 0f00 0101 0000 0000 0005 1200 0000  ?...............
00010c0: 0002 1800 3f00 0f00 0102 0000 0000 0005  ....?...........
00010d0: 2000 0000 2002 0000 0002 1400 1900 0200   ... ...........
00010e0: 0101 0000 0000 0001 0000 0000 0002 1400  ................
00010f0: 1900 0200 0101 0000 0000 0005 0c00 0000  ................
0001100: 0102 0000 0000 0005 2000 0000 2002 0000  ........ ... ...
0001110: 0101 0000 0000 0005 1200 0000 0000 0000  ................
0001120: a0ff ffff 6e6b 2000 3eb5 f30a 3eba cf01  ....nk .>...>...
0001130: 0000 0000 2000 0000 0500 0000 0100 0000  .... ...........
0001140: 6828 0200 701f 0080 0000 0000 ffff ffff  h(..p...........
0001150: 7800 0000 ffff ffff 1c00 0000 0000 0000  x...............
0001160: 0000 0000 0000 0000 0000 0000 0900 0000  ................
0001170: 4445 5649 4345 4d41 5000 0000 0000 0000  DEVICEMAP.......
0001180: f0ff ffff 6c66 0100 0802 0000 5379 7374  ....lf......Syst
0001190: a0ff ffff 6e6b 2000 00fc 6d03 3eba cf01  ....nk ...m.>...
00011a0: 0000 0000 2000 0000 0100 0000 0000 0000  .... ...........
00011b0: 8001 0000 ffff ffff 0000 0000 ffff ffff  ................
00011c0: 7800 0000 ffff ffff 0c00 0000 0000 0000  x...............
00011d0: 0000 0000 0000 0000 0000 0000 0b00 0000  ................
00011e0: 4445 5343 5249 5054 494f 4e00 0000 0000  DESCRIPTION.....
00011f0: f0ff ffff 6c66 0100 901b 0000 494e 5445  ....lf......INTE
0001200: f8ff ffff 181a 0000 a8ff ffff 6e6b 2000  ............nk .
0001210: b68f c70b 3eba cf01 0000 0000 9001 0000  ....>...........
0001220: 0300 0000 0200 0000 f012 0000 a05a 0080  .............Z..
0001230: 0800 0000 8017 0000 7800 0000 ffff ffff  ........x.......
0001240: 2c00 0000 0000 0000 2a00 0000 6600 0000  ,.......*...f...
0001250: 0000 0000 0600 0000 5379 7374 656d 0000  ........System..
0001260: d0ff ffff 766b 1500 1000 0000 9002 0000  ....vk..........
0001270: 0300 0000 0100 0000 436f 6d70 6f6e 656e  ........Componen
0001280: 7420 496e 666f 726d 6174 696f 6e00 0000  t Information...
[snip]
You may also dump only one registry at a time by using the virtual offset of the hive:
$ python vol.py -f voltest.dmp --profile=Win7SP1x86 hivelist
Volatility Foundation Volatility Framework 2.4
Virtual    Physical   Name
---------- ---------- ----
[snip]
0x8cec09d0 0x0d1f19d0 \??\C:\Users\test\ntuser.dat
[snip]

$ python vol.py -f voltest.dmp --profile=Win7SP1x86 dumpregistry -o 0x8cec09d0 -D output/
Volatility Foundation Volatility Framework 2.4
**************************************************
Writing out registry: registry.0x8cec09d0.ntuserdat.reg

Physical layer returned None for index 9000, filling with NULL
Physical layer returned None for index a000, filling with NULL
Physical layer returned None for index b000, filling with NULL
Physical layer returned None for index c000, filling with NULL
Physical layer returned None for index d000, filling with NULL
Physical layer returned None for index e000, filling with NULL
Physical layer returned None for index f000, filling with NULL
Physical layer returned None for index 10000, filling with NULL
Physical layer returned None for index 11000, filling with NULL
Physical layer returned None for index 20000, filling with NULL
Physical layer returned None for index 21000, filling with NULL

$ file output/*
output/registry.0x8cec09d0.ntuserdat.reg: MS Windows registry file, NT/2000 or above
Volatility supports memory dumps in several different formats, to ensure the highest compatibility with different acquisition tools. You can analyze hibernation files, crash dumps, virtualbox core dumps, etc in the same way as any raw memory dump and Volatility will detect the underlying file format and apply the appropriate address space. You can also convert between file formats.
Information from the crashdump header can be printed using the crashinfo command. You will see information like that of the Microsoft dumpcheck utility.
$ python vol.py -f win7_x64.dmp --profile=Win7SP0x64 crashinfo
Volatility Foundation Volatility Framework 2.4
_DMP_HEADER64:
 Majorversion:         0x0000000f (15)
 Minorversion:         0x00001db0 (7600)
 KdSecondaryVersion    0x00000000
 DirectoryTableBase    0x32a44000
 PfnDataBase           0xfffff80002aa8220
 PsLoadedModuleList    0xfffff80002a3de50
 PsActiveProcessHead   0xfffff80002a1fb30
 MachineImageType      0x00008664
 NumberProcessors      0x00000002
 BugCheckCode          0x00000000
 KdDebuggerDataBlock   0xfffff800029e9070
 ProductType           0x00000001
 SuiteMask             0x00000110
 WriterStatus          0x00000000
 Comment               PAGEPAGEPAGEPAGEPAGEPAGE[snip]

Physical Memory Description:
Number of runs: 3
FileOffset    Start Address    Length
00002000      00001000         0009e000
000a0000      00100000         3fde0000
3fe80000      3ff00000         00100000
3ff7f000      3ffff000
The hibinfo command reveals additional information stored in the hibernation file, including the state of the Control Registers, such as CR0, etc. It also identifies the time at which the hibernation file was created, the state of the hibernation file, and the version of windows being hibernated. Example output for the function is shown below.
$ python vol.py -f hiberfil.sys --profile=Win7SP1x64 hibinfo
IMAGE_HIBER_HEADER:
Signature: HIBR
SystemTime: 2011-12-23 16:34:27

Control registers flags
CR0: 80050031
CR0[PAGING]: 1
CR3: 00187000
CR4: 000006f8
CR4[PSE]: 1
CR4[PAE]: 1

Windows Version is 6.1 (7601)
The imagecopy command allows you to convert any existing type of address space (such as a crashdump, hibernation file, virtualbox core dump, vmware snapshot, or live firewire session) to a raw memory image. This conversion be necessary if some of your other forensic tools only support reading raw memory dumps.
The profile should be specified for this command, so if you don't know it already, use the kdbgscan or imageinfo commands first. The output file is specified with the -O flag. The progress is updated as the file is converted:
$ python vol.py -f win7_x64.dmp --profile=Win7SP0x64 imagecopy -O copy.raw
Volatility Foundation Volatility Framework 2.4
Writing data (5.00 MB chunks): |.......................................|
To convert a raw memory dump (for example from a win32dd acquisition or a VMware .vmem file) into a Microsoft crash dump, use the raw2dmp command. This is useful if you want to load the memory in the WinDbg kernel debugger for analysis.
$ python vol.py -f ~/Desktop/win7_trial_64bit.raw --profile=Win7SP0x64 raw2dmp -O copy.dmp
Volatility Foundation Volatility Framework 2.4
Writing data (5.00 MB chunks): |..............................................................................|
To pull details from a virtualbox core dump, use the vboxinfo command.
$ python vol.py -f ~/Desktop/win7sp1x64_vbox.elf --profile=Win7SP1x64 vboxinfo
Volatility Foundation Volatility Framework 2.4

Magic: 0xc01ac0de
Format: 0x10000
VirtualBox 4.1.23 (revision 80870)
CPUs: 1

File Offset        PhysMem Offset     Size
------------------ ------------------ ------------------
0x0000000000000758 0x0000000000000000 0x00000000e0000000
0x00000000e0000758 0x00000000e0000000 0x0000000003000000
0x00000000e3000758 0x00000000f0400000 0x0000000000400000
0x00000000e3400758 0x00000000f0800000 0x0000000000004000
0x00000000e3404758 0x00000000ffff0000 0x0000000000010000
0x00000000e3414758 0x0000000100000000 0x000000006a600000
Use this plugin to analyze header information from vmware saved state (vmss) or vmware snapshot (vmsn) files. The metadata contains CPU registers, the entire VMX configuration file, memory run information, and PNG screenshots of the guest VM.
$ python vol.py -f ~/Desktop/Win7SP1x64-d8737a34.vmss vmwareinfo --verbose | less

Magic: 0xbad1bad1 (Version 1)
Group count: 0x5c

File Offset PhysMem Offset Size
----------- -------------- ----------
0x000010000 0x000000000000 0xc0000000
0x0c0010000 0x000100000000 0xc0000000

DataOffset   DataSize Name                                               Value
---------- ---------- -------------------------------------------------- -----
0x00001cd9        0x4 Checkpoint/fileversion                             0xa
0x00001cfc      0x100 Checkpoint/ProductName
0x00001cfc  56 4d 77 61 72 65 20 45 53 58 00 00 00 00 00 00   VMware.ESX......
0x00001d0c  00 00 00 00 00 00 00 00 00 00 00 00 00 00 00 00   ................
[snip]
0x00001e1d      0x100 Checkpoint/VersionNumber
0x00001e1d  34 2e 31 2e 30 00 00 00 00 00 00 00 00 00 00 00   4.1.0...........
0x00001e2d  00 00 00 00 00 00 00 00 00 00 00 00 00 00 00 00   ................
[snip]
0x00002046        0x4 Checkpoint/Platform                                0x1
0x00002055        0x4 Checkpoint/usageMode                               0x1
0x00002062        0x4 Checkpoint/memSize                                 0x1800
......
This plugin shows info from an hpak formatted memory dump created by FDPro.exe.
$ python vol.py -f memdump.hpak hpakinfo
Header:     HPAKSECTHPAK_SECTION_PHYSDUMP
Length:     0x20000000
Offset:     0x4f8
NextOffset: 0x200004f8
Name:       memdump.bin
Compressed: 0

Header:     HPAKSECTHPAK_SECTION_PAGEDUMP
Length:     0x30000000
Offset:     0x200009d0
NextOffset: 0x500009d0
Name:       dumpfile.sys
Compressed: 0
If you have an hpak file whose contents are compressed, you can extract and decompress the physical memory image using this plugin.
Scans for and parses potential Master Boot Records (MBRs). There are different options for finding MBRs and filtering output. For more information please see Recovering Master Boot Records from Memory. While this plugin was written with Windows bootkits in mind, it can also be used with memory samples from other systems.
When run without any extra options, mbrparser scans for and returns information all potential MBRs defined by signature ('\x55\xaa') found in memory. Information includes: disassembly of bootcode (must have distorm3 installed) and partition information. This will most likely have false positives.
If distorm3 is not installed, the -H/--hex option can be used to get the entire bootcode section in hex instead of disassembly:
$ python vol.py -f [sample] mbrparser -H
If the physical offset of the MBR is known, it can be specified with the -o/--offset= option for example:
$ python vol.py -f [sample] -o 0x600 mbrparser
If the md5 hash of the desired bootcode is known, one can be specified using either the -M/--hash (the hash of bootcode up to the RET instruction) or -F/--fullhash (the hash of full bootcode) option.
$ python vol.py mbrparser -f AnalysisXPSP3.vmem -M 6010862faee6d5e314aba791380d4f41
or
$ python vol.py mbrparser -f AnalysisXPSP3.vmem -F 6010862faee6d5e314aba791380d4f41
In order to cut down on false positives there is a -C/--check option that checks the partition table for one bootable partition that has a known, nonempty type (NTFS, FAT*, etc).
$ python vol.py -f [sample] -C mbrparser
There is also an option to change the offset for the start of the disassembly. This can be useful for investigating machines (like Windows XP) that only copy the part of the MBR bootcode that has not yet executed. For example, before changing the offset:
$ python vol.py mbrparser -f AnalysisXPSP3.vmem -o 0x600
Volatility Foundation Volatility Framework 2.4
Potential MBR at physical offset: 0x600
Disk Signature: d8-8f-d8-8f
Bootcode md5: c1ca166a3417427890520bbb18911b1f
Bootcode (FULL) md5: c0bf3a94515bbd70e5a0af82f1804d89
Disassembly of Bootable Code:
0x00000600: 0000                             ADD [BX+SI], AL
0x00000602: 0000                             ADD [BX+SI], AL
0x00000604: 0000                             ADD [BX+SI], AL
0x00000606: 0000                             ADD [BX+SI], AL
0x00000608: 0000                             ADD [BX+SI], AL
0x0000060a: 0000                             ADD [BX+SI], AL
0x0000060c: 0000                             ADD [BX+SI], AL
0x0000060e: 0000                             ADD [BX+SI], AL
0x00000610: 0000                             ADD [BX+SI], AL
0x00000612: 0000                             ADD [BX+SI], AL
0x00000614: 0000                             ADD [BX+SI], AL
0x00000616: 0000                             ADD [BX+SI], AL
0x00000618: 0000                             ADD [BX+SI], AL
0x0000061a: 00bdbe07                         ADD [DI+0x7be], BH
0x0000061e: b104                             MOV CL, 0x4
0x00000620: 386e00                           CMP [BP+0x0], CH
[snip]
After changing the starting offset:
$ python vol.py mbrparser -f AnalysisXPSP3.vmem -o 0x600 -D 0x1b
Volatility Foundation Volatility Framework 2.4
Potential MBR at physical offset: 0x600
Disk Signature: d8-8f-d8-8f
Bootcode md5: 961f3ad835d6fa9396e60ea9f825c393
Bootcode (FULL) md5: f54546c199c72389f20d537997d50c66
Disassembly of Bootable Code:
0x0000061b: bdbe07                           MOV BP, 0x7be
0x0000061e: b104                             MOV CL, 0x4
0x00000620: 386e00                           CMP [BP+0x0], CH
0x00000623: 7c09                             JL 0x13
0x00000625: 7513                             JNZ 0x1f
0x00000627: 83c510                           ADD BP, 0x10
0x0000062a: e2f4                             LOOP 0x5
[snip]
This plugin scans for potential Master File Table (MFT) entries in memory (using "FILE" and "BAAD" signatures) and prints out information for certain attributes, currently: $FILE_NAME ($FN), $STANDARD_INFORMATION ($SI), $FN and $SI attributes from the $ATTRIBUTE_LIST, $OBJECT_ID (default output only) and resident $DATA. This plugin has room for expansion, however, and VTypes for other attributes are already included. For more information please see Reconstructing the MBR and MFT from Memory (OMFW 2012 slides). Options of interest include:
-
--machine- Machine name to add to timeline header (useful when combining timelines from multiple machines) -
-D/--dump-dir- Output directory to which resident data files are dumped -
--output=body- print output in Sleuthkit 3.X body format -
--no-check- Prints out all entries including those with null timestamps -
-E/--entry-size- Changes the default 1024 byte MFT entry size. -
-o/--offset- Prints out the MFT entry at a give offset (comma delimited)
This plugin may take a while to run before seeing output, since it scans first and then builds the directory tree for full file paths.
Example (default output):
$ python vol.py -f Bob.vmem mftparser
Volatility Foundation Volatility Framework 2.4
Scanning for MFT entries and building directory, this can take a while
[snip]
***************************************************************************
MFT entry found at offset 0x1e69c00
Type: File
Record Number: 12091
Link count: 2


$STANDARD_INFORMATION
Creation             Modified             MFT Altered          Access Date          Type
-------------------- -------------------- -------------------- -------------------- ----
2010-02-27 20:12:32  2010-02-27 20:12:32  2010-02-27 20:12:32  2010-02-27 20:12:32  Archive

$FILE_NAME
Creation             Modified             MFT Altered          Access Date          Name/Path
-------------------- -------------------- -------------------- -------------------- ---------
2010-02-27 20:12:32  2010-02-27 20:12:32  2010-02-27 20:12:32  2010-02-27 20:12:32  Documents and Settings\Administrator\Cookies\ADMINI~1.TXT

$FILE_NAME
Creation             Modified             MFT Altered          Access Date          Name/Path
-------------------- -------------------- -------------------- -------------------- ---------
2010-02-27 20:12:32  2010-02-27 20:12:32  2010-02-27 20:12:32  2010-02-27 20:12:32  Documents and Settings\Administrator\Cookies\administrator@search-network-plus[1].txt

$DATA
0000000000: 65 78 70 0a 31 39 0a 73 65 61 72 63 68 2d 6e 65   exp.19.search-ne
0000000010: 74 77 6f 72 6b 2d 70 6c 75 73 2e 63 6f 6d 2f 0a   twork-plus.com/.
0000000020: 31 35 33 36 0a 33 03 00 32 34 33 33 39 32 30 0a   1536.3..2433920.
0000000030: 33 30 30 36 32 36 30 35 0a 38 33 37 34 31 36 35   30062605.8374165
0000000040: 37 36 0a 33 30 30 36 32 35 36 39 0a 2a 0a         76.30062569.*.

***************************************************************************
[snip]
***************************************************************************
MFT entry found at offset 0x1cdbac00
Type: In Use & File
Record Number: 12079
Link count: 1


$STANDARD_INFORMATION
Creation             Modified             MFT Altered          Access Date          Type
-------------------- -------------------- -------------------- -------------------- ----
2010-02-27 20:12:28  2010-02-27 20:12:28  2010-02-27 20:12:28  2010-02-27 20:12:28  Archive

$FILE_NAME
Creation             Modified             MFT Altered          Access Date          Name/Path
-------------------- -------------------- -------------------- -------------------- ---------
2010-02-27 20:12:28  2010-02-27 20:12:28  2010-02-27 20:12:28  2010-02-27 20:12:28  Documents and Settings\Administrator\Local Settings\Temp\plugtmp\PDF.php

$DATA
Non-Resident

***************************************************************************
[snip]
The bodyfile output is also an option. It is recommended that the output be stored in a file using the --output-file option, since it is quite lengthy. The following shows creating a bodyfile using mftparser while dumping resident files. You can also see a file of interest that is created on the system (f.txt) which happens to be recovered in the output directory:
$ python vol.py -f grrcon.img mftparser --output=body -D output --output-file=grrcon_mft.body
Volatility Foundation Volatility Framework 2.4
Scanning for MFT entries and building directory, this can take a while

$ cat grrcon_mft.body
[snip]
0|[MFT STD_INFO] WINDOWS\system32\systems (Offset: 0x15938400)|12029|---------------|0|0|0|1335579320|1335579320|1335579320|1335578463
0|[MFT FILE_NAME] WINDOWS\system32\systems\f.txt (Offset: 0x15938800)|12030|---a-----------|0|0|0|1335578503|1335578503|1335578503|1335578503
0|[MFT STD_INFO] WINDOWS\system32\systems\f.txt (Offset: 0x15938800)|12030|---a-----------|0|0|0|1335578503|1335578503|1335578503|1335578503
0|[MFT FILE_NAME] WINDOWS\system32\systems\g.exe (Offset: 0x15938c00)|12031|---a-----------|0|0|0|1335578514|1335578514|1335578514|1335578514
0|[MFT STD_INFO] WINDOWS\system32\systems\g.exe (Offset: 0x15938c00)|12031|---a-----------|0|0|0|1335579014|1335578514|1335578514|1335578514
0|[MFT FILE_NAME] WINDOWS\inf\divasrv.inf (Offset: 0x15c83000)|2192|---a-----------|0|0|22554|1332601266|1332601266|1332601266|1332601235
[snip]

$ ls output/*15938800*
output/file.0x15938800.data0.dmp

$ cat output/*15938800*
open 66.32.119.38
jack
2awes0me
lcd c:\WINDOWS\System32\systems
cd  /home/jack
binary
mput "*.txt"
disconnect
bye
The Sleuthkit mactime utility can then be used to output the bodyfile in a readable manner:
$ mactime -b grrcon_mft.body -d -z UTC |less
[snip]
Sat Apr 28 2012 02:01:43,0,macb,---a-----------,0,0,12030,"[MFT FILE_NAME] WINDOWS\system32\systems\f.txt (Offset: 0x15938800)"
Sat Apr 28 2012 02:01:43,0,macb,---a-----------,0,0,12030,"[MFT STD_INFO] WINDOWS\system32\systems\f.txt (Offset: 0x15938800)"
Sat Apr 28 2012 02:01:54,0,macb,---a-----------,0,0,12031,"[MFT FILE_NAME] WINDOWS\system32\systems\g.exe (Offset: 0x15938c00)"
Sat Apr 28 2012 02:01:54,0,m.cb,---a-----------,0,0,12031,"[MFT STD_INFO] WINDOWS\system32\systems\g.exe (Offset: 0x15938c00)"
Sat Apr 28 2012 02:02:05,0,macb,---a-----------,0,0,12032,"[MFT FILE_NAME] WINDOWS\system32\systems\p.exe (Offset: 0x18229000)"
Sat Apr 28 2012 02:02:05,0,...b,---a-----------,0,0,12032,"[MFT STD_INFO] WINDOWS\system32\systems\p.exe (Offset: 0x18229000)"
Sat Apr 28 2012 02:02:06,0,m...,---a-----------,0,0,12032,"[MFT STD_INFO] WINDOWS\system32\systems\p.exe (Offset: 0x18229000)"
Sat Apr 28 2012 02:02:17,0,macb,---a-----------,0,0,12033,"[MFT FILE_NAME] WINDOWS\system32\systems\r.exe (Offset: 0x18229400)"
Sat Apr 28 2012 02:02:17,0,m.cb,---a-----------,0,0,12033,"[MFT STD_INFO] WINDOWS\system32\systems\r.exe (Offset: 0x18229400)"
Sat Apr 28 2012 02:02:26,0,macb,---a-----------,0,0,12034,"[MFT FILE_NAME] WINDOWS\system32\systems\sysmon.exe (Offset: 0x18229800)"
Sat Apr 28 2012 02:02:26,0,...b,---a-----------,0,0,12034,"[MFT STD_INFO] WINDOWS\system32\systems\sysmon.exe (Offset: 0x18229800)"
Sat Apr 28 2012 02:02:27,0,m.c.,---a-----------,0,0,12034,"[MFT STD_INFO] WINDOWS\system32\systems\sysmon.exe (Offset: 0x18229800)"
[snip]
For a given image and a file with lines of the form <decimal_offset>:<string>, or <decimal_offset> <string>,
output the corresponding process and virtual addresses where that
string can be found. Expected input for this tool is the output of
Microsoft Sysinternals' Strings utility, or another utility that
provides similarly formatted offset:string mappings. Note that the
input offsets are physical offsets from the start of the file/image.
Sysinternals Strings can be used on Linux/Mac using Wine. Output should be redirected to a file to be fed to the Volatility strings plugin. If you're using GNU strings command, use the -td flags to produce offsets in decimal (the plugin does not accept hex offsets). Some example usages are as follows:
Windows
C:\> strings.exe –q –o -accepteula win7.dd > win7_strings.txt
It can take a while for the Sysinternals strings program to finish. The –q and –o switches are imperative, since they make sure the header is not output (-q) and that there is an offset for each line (-o).
Linux/Mac
You can use the Sysinternals strings program with wine:
$ wine strings.exe –q –o -accepteula win7.dd > win7_strings.txt
You can also use the GNU strings utility that comes with Linux and Mac (Note: the default strings utility on Mac does not have Unicode support. You can install the GNU binutils package in order to get a strings utility that does). You should use the -td flags to get the decimal offset and will have to make a second pass with the -el flags in order to get (little endian) Unicode strings. Notice that the second pass appends (>>) to the existing file:
$ strings -a -td win7.dd > win7_strings.txt
$ strings -a -td -el win7.dd >> win7_strings.txt
The result should be a text file that contains the offset and strings from the image for example:
16392:@@@
17409:
17441:
17473:"""
17505:###
17537:$$$
17569:%%%
17601:&&&
17633:'''
17665:(((
17697:)))
17729:***
EnCase Keyword Export
You can also use EnCase to export keywords and offsets in this format with some tweaking. One thing to note is that EnCase exports text in UTF-16 with a BOM of (U+FEFF) which can cause issues with the strings plugin. An example look at the exported keyword file:
File Offset Hit Text
114923  DHCP
114967  DHCP
115892  DHCP
115922  DHCP
115952  DHCP
116319  DHCP

[snip]
Now tweaking the file by removing the header and tabs we have:
114923:DHCP
114967:DHCP
115892:DHCP
115922:DHCP
115952:DHCP
116319:DHCP

[snip]
We can see that it is UTF-16 and has a BOM of (U+FEFF) by using a hex editor.
$ file export.txt
export.txt: Little-endian UTF-16 Unicode text, with CRLF, CR line terminators

$ xxd export.txt |less

0000000: fffe 3100 3100 3400 3900 3200 3300 3a00  ..1.1.4.9.2.3.:.

[snip]
We have to convert this to ANSI or UTF-8. In Windows you can open the text file and use the "Save As" dialog to save the file as ANSI (in the "Encoding" drop-down menu). In Linux you can use iconv:
$ iconv -f UTF-16 -t UTF-8 export.txt > export1.txt
NOTE: You must make sure there are NO blank lines in your final "strings" file.
Now we can see a difference in how these two files are handled:
$ python vol.py -f Bob.vmem --profile=WinXPSP2x86 strings -s export.txt
Volatility Foundation Volatility Framework 2.4
ERROR   : volatility.plugins.strings: String file format invalid.

$ python vol.py -f Bob.vmem --profile=WinXPSP2x86 strings -s export1.txt
Volatility Foundation Volatility Framework 2.4
0001c0eb [kernel:2147598571] DHCP
0001c117 [kernel:2147598615] DHCP
0001c4b4 [kernel:2147599540] DHCP
0001c4d2 [kernel:2147599570] DHCP
0001c4f0 [kernel:2147599600] DHCP
0001c65f [kernel:2147599967] DHCP
0001c686 [kernel:2147600006] DHCP

[snip]
NOTE: The Volatility strings output is very verbose and it is best to redirect or save to a file. The following command saves the output using the --output-file option and filename "win7_vol_strings.txt"
$ python vol.py --profile=Win7SP0x86 strings –f win7.dd –s win7_strings.txt --output-file=win7_vol_strings.txt
By default strings will only provide output for processes found by walking the doubly linked list pointed to by PsActiveProcessHead (see pslist) in addition to kernel addresses. strings can also provide output for hidden processes (see psscan) by using the (capital) -S switch:
$ python vol.py --profile=Win7SP0x86 strings –f win7.dd –s win7_strings.txt --output-file=win7_vol_strings.txt -S
Also an EPROCESS offset can be provided:
$ python vol.py --profile=Win7SP0x86 strings –f win7.dd –s win7_strings.txt --output-file=win7_vol_strings.txt -o 0x04a291a8
The strings plugin takes a while to complete. When it completes, you should have an output file with each line in the following format:
physical_address [kernel_or_pid:virtual_address] string
In the example output you can see PIDs/kernel references:
$ less win7_vol_strings.txt

000003c1 [kernel:4184445889] '<'@
00000636 [kernel:4184446518] 8,t
000006c1 [kernel:4184446657] w#r
000006d8 [kernel:4184446680] sQOtN2
000006fc [kernel:4184446716] t+a`j
00000719 [kernel:4184446745] aas
0000072c [kernel:4184446764] Invalid partition ta
00000748 [kernel:4184446792] r loading operating system
00000763 [kernel:4184446819] Missing operating system
000007b5 [kernel:4184446901] ,Dc
0000400b [kernel:2147500043 kernel:4184461323] 3TYk
00004056 [kernel:2147500118 kernel:4184461398] #:s
000040b0 [kernel:2147500208 kernel:4184461488] CO0
000040e9 [kernel:2147500265 kernel:4184461545] BrvWo
000040f0 [kernel:2147500272 kernel:4184461552] %Sz
000040fc [kernel:2147500284 kernel:4184461564] A0?0=
00004106 [kernel:2147500294 kernel:4184461574] 7http://crl.microsoft.com/pki/crl/products/WinIntPCA.crl0U

[snip]

00369f14 [1648:1975394068] Ph$
00369f2e [1648:1975394094] 9}$
00376044 [1372:20422724] Ju0w
0037616d [1372:20423021] msxml6.dll
003761e8 [1372:20423144] U'H
003762e3 [1372:20423395] }e_
0037632e [1372:20423470] xnA

[snip]

03678031 [360:2089816113 596:2089816113 620:2089816113 672:2089816113 684:2089816113 844:2089816113 932:2089816113 1064:2089816113 1164:2089816113 1264:2089816113 1516:2089816113 1648
:2089816113 1896:2089816113 1904:2089816113 1756:2089816113 512:2089816113 1372:2089816113 560:2089816113] A$9B
Once you have the strings output, you can see which process(es) have the suspicious string in memory and can then narrow your focus. You can grep for the string or pattern depending on the context you were given. For example, if you are looking for a particular command:
$ grep [command or pattern] win7_vol_strings.txt > strings_of_interest.txt
For all IPs:
$ cat win7_vol_strings.txt | \
perl -e 'while(<>){if(/(?:(?:25[0-5]|2[0-4][0-9]|[01]?[0-9][0-9]?)\.){3}(?:25[0-5]|2[0-4][0-9]|[01]?[0-9][0-9]?)/){print $_;}}' > IPs.txt
For all URLs:
$ cat win7_vol_strings.txt | \
perl -e 'while(<>){ if(/(http|https|ftp|mail)\:[\/\w.]+/){print $_;}}' > URLs.txt
Depending on the context, your searches will vary.
If you want to interactively explore a memory image, use the volshell command. This gives you an interface similar to WinDbg into the memory dump. For example, you can:
- List processes
- Switch into a process's context
- Display types of structures/objects
- Overlay a type over a given address
- Walk linked lists
- Disassemble code at a given address
Note: volshell can take advantage of IPython if you have it installed. This will add tab-completion and saved command history.
To break into a volshell:
$ python vol.py --profile=Win7SP0x86 -f win7.dmp volshell
Volatility Foundation Volatility Framework 2.0
Current context: process System, pid=4, ppid=0 DTB=0x185000
Welcome to volshell Current memory image is:
file:///Users/M/Desktop/win7.dmp
To get help, type 'hh()'
>>> hh()
ps()                                     : Print a process listing.
cc(offset=None, pid=None, name=None)     : Change current shell context.
dd(address, length=128, space=None)      : Print dwords at address.
db(address, length=128, width=16, space=None) : Print bytes as canonical hexdump.
hh(cmd=None)                             : Get help on a command.
dt(objct, address=None, address_space=None)  : Describe an object or show type info.
list_entry(head, objname, offset=-1, fieldname=None, forward=True) : Traverse a _LIST_ENTRY.
dis(address, length=128, space=None)     : Disassemble code at a given address.

For help on a specific command, type 'hh(<command>)'
>>>
Let's say you want to see what's at 0x779f0000 in the memory of explorer.exe. First display the processes so you can get the PID or offset of Explorer's EPROCESS. (Note: if you want to view data in kernel memory, you do not need to switch contexts first.)
>>> ps()
Name             PID    PPID   Offset
System           4      0      0x83dad960
smss.exe         252    4      0x84e47840
csrss.exe        348    340    0x8d5ffd40
wininit.exe      384    340    0x84e6e3d8
csrss.exe        396    376    0x8d580530
winlogon.exe     424    376    0x8d598530
services.exe     492    384    0x8d4cc030
lsass.exe        500    384    0x8d6064a0
lsm.exe          508    384    0x8d6075d8
svchost.exe      616    492    0x8d653030
svchost.exe      680    492    0x8d673b88
svchost.exe      728    492    0x8d64fb38
taskhost.exe     1156   492    0x8d7ee030
dwm.exe          956    848    0x8d52bd40
explorer.exe     1880   1720   0x8d66c1a8
wuauclt.exe      1896   876    0x83ec3238
VMwareTray.exe   2144   1880   0x83f028d8
VMwareUser.exe   2156   1880   0x8d7893b0
[snip]
Now switch into Explorer's context and print the data with either db (display as canonical hexdump) or dd (display as double-words):
>>> dd(0x779f0000)
779f0000  00905a4d 00000003 00000004 0000ffff
779f0010  000000b8 00000000 00000040 00000000
779f0020  00000000 00000000 00000000 00000000
779f0030  00000000 00000000 00000000 000000e0
779f0040  0eba1f0e cd09b400 4c01b821 685421cd
779f0050  70207369 72676f72 63206d61 6f6e6e61
779f0060  65622074 6e757220 206e6920 20534f44
779f0070  65646f6d 0a0d0d2e 00000024 00000000
>>> db(0x779f0000)
779f0000   4d 5a 90 00 03 00 00 00 04 00 00 00 ff ff 00 00    MZ..............
779f0010   b8 00 00 00 00 00 00 00 40 00 00 00 00 00 00 00    ........@.......
779f0020   00 00 00 00 00 00 00 00 00 00 00 00 00 00 00 00    ................
779f0030   00 00 00 00 00 00 00 00 00 00 00 00 e0 00 00 00    ................
779f0040   0e 1f ba 0e 00 b4 09 cd 21 b8 01 4c cd 21 54 68    ..........L.Th
779f0050   69 73 20 70 72 6f 67 72 61 6d 20 63 61 6e 6e 6f    is program canno
779f0060   74 20 62 65 20 72 75 6e 20 69 6e 20 44 4f 53 20    t be run in DOS
779f0070   6d 6f 64 65 2e 0d 0d 0a 24 00 00 00 00 00 00 00    mode....$.......
So there is a PE at 0x779f0000 in explorer.exe. If you want to disassemble instructions at RVA 0x2506 in the PE, do this:
>>> dis(0x779f0000 + 0x2506)
0x779f2506 8d0c48                           LEA ECX, [EAX+ECX*2]
0x779f2509 8b4508                           MOV EAX, [EBP+0x8]
0x779f250c 8b4c4802                         MOV ECX, [EAX+ECX*2+0x2]
0x779f2510 8d0448                           LEA EAX, [EAX+ECX*2]
0x779f2513 e9c07f0300                       JMP 0x77a2a4d8
0x779f2518 85f6                             TEST ESI, ESI
0x779f251a 0f85c12c0700                     JNZ 0x77a651e1
0x779f2520 8b4310                           MOV EAX, [EBX+0x10]
0x779f2523 8b407c                           MOV EAX, [EAX+0x7c]
0x779f2526 8b4b18                           MOV ECX, [EBX+0x18]
0x779f2529 0fb7444102                       MOVZX EAX, [ECX+EAX*2+0x2]
0x779f252e 894520                           MOV [EBP+0x20], EAX
[snip]
If you want to remind yourself of the members in an EPROCESS object for the given OS, do this:
>>> dt("_EPROCESS")
'_EPROCESS' (704 bytes)
0x0   : Pcb                            ['_KPROCESS']
0x98  : ProcessLock                    ['_EX_PUSH_LOCK']
0xa0  : CreateTime                     ['_LARGE_INTEGER']
0xa8  : ExitTime                       ['_LARGE_INTEGER']
0xb0  : RundownProtect                 ['_EX_RUNDOWN_REF']
0xb4  : UniqueProcessId                ['pointer', ['void']]
0xb8  : ActiveProcessLinks             ['_LIST_ENTRY']
0xc0  : ProcessQuotaUsage              ['array', 2, ['unsigned long']]
0xc8  : ProcessQuotaPeak               ['array', 2, ['unsigned long']]
0xd0  : CommitCharge                   ['unsigned long']
0xd4  : QuotaBlock                     ['pointer', ['_EPROCESS_QUOTA_BLOCK']]
[snip]
To overlay the EPROCESS types onto the offset for explorer.exe, do this:
>>> dt("_EPROCESS", 0x8d66c1a8)
[_EPROCESS _EPROCESS] @ 0x8D66C1A8
0x0   : Pcb                            2372321704
0x98  : ProcessLock                    2372321856
0xa0  : CreateTime                     2010-07-06 22:38:07
0xa8  : ExitTime                       1970-01-01 00:00:00
0xb0  : RundownProtect                 2372321880
0xb4  : UniqueProcessId                1880
0xb8  : ActiveProcessLinks             2372321888
0xc0  : ProcessQuotaUsage              -
0xc8  : ProcessQuotaPeak               -
0xd0  : CommitCharge                   4489
0xd4  : QuotaBlock                     2372351104
[snip]
The db, dd, dt, and dis commands all accept an optional "space" parameter which allows you to specify an address space. You will see different data depending on which address space you're using. Volshell has some defaults and rules that are important to note:
-
If you don't supply an address space and have not switched into a process context with cc, then you'll be using the default kernel space (System process).
-
If you don't supply an address space and have switched into a process context with cc, then you'll be using the space of the active/current process.
-
If you explicitly supply an address space, the one you supplied will be used.
Imagine you're using one of the scan commands (psscan, connscan, etc.) and you think it has picked up a false positive. The scan commands output a physical offset (offset into the memory dump file). You want to explore the data around the potential false positive to determine for yourself if any structure members appear sane or not. One way you could do that is by opening the memory dump in a hex viewer and going to the physical offset to view the raw bytes. However, a better way is to use volshell and overlay the structure question to the alleged physical offset. This allows you to see the fields interpreted as their intended type (DWORD, string, short, etc.)
Here's an example. First instantiate a physical address space:
>>> physical_space = utils.load_as(self._config, astype = 'physical')
Assuming the alleged false positive for an EPROCESS is at 0x433308, you would then do:
>>> dt("_EPROCESS", 0x433308, physical_space)
[_EPROCESS _EPROCESS] @ 0x00433308
0x0   : Pcb                            4403976
0x6c  : ProcessLock                    4404084
0x70  : CreateTime                     1970-01-01 00:00:00
0x78  : ExitTime                       1970-01-01 00:00:00
...
Another neat trick is to use volshell in a non-interactive manner. For example, say you want to translate an address in kernel memory to its corresponding physical offset.
$ echo "hex(addrspace().vtop(0x823c8830))" | python vol.py -f stuxnet.vmem volshell
Volatility Foundation Volatility Framework 2.4
Current context: process System, pid=4, ppid=0 DTB=0x319000
Welcome to volshell Current memory image is:
file:///mem/stuxnet.vmem
To get help, type 'hh()'
>>> '0x25c8830'
Thus the kernel address 0x823c8830 translates to physical offset 0x25c8830 in the memory dump file.
You can execute multiple commands sequentially like this:
$ echo "cc(pid=4); dd(0x10000)" | [...]
For more information, see BDG's Introducing Volshell.
To read keystrokes from the BIOS area of memory, use the bioskbd command. This can reveal passwords typed into HP, Intel, and Lenovo BIOS and SafeBoot, TrueCrypt, and BitLocker software. Depending on the tool used to acquire memory, not all memory samples will contain the necessary BIOS area. For more information, see Andreas Schuster's Reading Passwords From the Keyboard Buffer, David Sharpe's Duplicating Volatility Bioskbd Command Function on Live Windows Systems, and Jonathan Brossard's Bypassing pre-boot authentication passwords by instrumenting the BIOS keyboard buffer.
The patcher plugin accepts a single argument of '-x' followed by an XML file. The XML file then specifies any required patches as in the following example:
<patchfile>
  <patchinfo method="pagescan" name="Some Descriptive Name">
    <constraints>
      <match offset="0x123">554433221100</match>
    </constraints>
    <patches>
      <setbytes offset="0x234">001122334455</setbytes>
    </patches>
  </patchinfo>
  <patchinfo>
    ...
  </patchinfo>
</patchfile>
The XML root element is always patchfile, and contains any number of patchinfo elements. When the patchfile is run, it will scan over the memory once for each patchinfo, attempting to scan using the method specified in the method attribute. Currently the only support method is pagescan and this must be explicitly declared in each patchinfo element.
Each pagescan type patchinfo element contains a single constraints element and a single patches element. The scan then proceeds over each page in memory, verifying that all constraints are met, and if so, the instructions specified in the patches element are carried out.
The constraints element contains any number of match elements which take a specific offset attribute (specifying where within the page the match should occur) and then contain a hexadecimal string for the bytes that are supposed to match.
The patches element contains any number of setbytes elements which take a specific offset attribute (specifying where with the page the patch should modify data) and then contains a hexidecimal string for the bytes that should be written into the page.
Note: When running the patcher plugin, there will be no modification made to memory unless the write option (-w) has been specified on the command line.
The pagecheck plugin uses a kernel DTB (from the System/Idle process) and determines which pages should be memory resident (using the AddressSpace.get_available_pages method). For each page, it attempts to access the page data and reports details, such as the PDE and PTE addresses if the attempt fails. This is a diagnostic plugin, usually helpful in troubleshooting "holes" in an address space.
This plugin is not well-supported. It is in the contrib directory and currently only works with non-PAE x86 address spaces.
$ python vol.py --plugins=contrib/plugins/ -f pat-2009-11-16.mddramimage pagecheck
Volatility Foundation Volatility Framework 2.4
(V): 0x06a5a000 [PDE] 0x038c3067 [PTE] 0x1fe5e047 (P): 0x1fe5e000 Size: 0x00001000
(V): 0x06c5f000 [PDE] 0x14d62067 [PTE] 0x1fe52047 (P): 0x1fe52000 Size: 0x00001000
(V): 0x06cd5000 [PDE] 0x14d62067 [PTE] 0x1fe6f047 (P): 0x1fe6f000 Size: 0x00001000
(V): 0x06d57000 [PDE] 0x14d62067 [PTE] 0x1fe5c047 (P): 0x1fe5c000 Size: 0x00001000
(V): 0x06e10000 [PDE] 0x14d62067 [PTE] 0x1fe62047 (P): 0x1fe62000 Size: 0x00001000
(V): 0x070e4000 [PDE] 0x1cac7067 [PTE] 0x1fe1e047 (P): 0x1fe1e000 Size: 0x00001000
(V): 0x077a8000 [PDE] 0x1350a067 [PTE] 0x1fe06047 (P): 0x1fe06000 Size: 0x00001000
(V): 0x07a41000 [PDE] 0x05103067 [PTE] 0x1fe05047 (P): 0x1fe05000 Size: 0x00001000
(V): 0x07c05000 [PDE] 0x103f7067 [PTE] 0x1fe30047 (P): 0x1fe30000 Size: 0x00001000
...
This timeliner plugin creates a timeline from various artifacts in memory from the following sources (items in parenthesis are filters that may be used with the --type flag in order to obtain only items of that artifact):
- System time (ImageDate)
- Processes (Process)
- Create and Exit times
- LastTrimTime (XP and 2003 only)
- DLLs (Process, LoadTime)
- LoadTime (Windows 7 and 8 only)
- PE Timestamps (TimeDateStamp)
- Modules/Processes/DLLs
- _IMAGE_FILE_HEADER
- _IMAGE_DEBUG_DIRECTORY
- Threads (Thread)
- Create and Exit times
- Sockets (Socket)
- Create time
- Event logs (XP and 2003 only) (EvtLog)
- IE History (IEHistory)
- Registry hives (_CMHIVE and _HBASE_BLOCK)
- Registry keys
- LastWriteTime of registry keys in _CMHIVE (Registry)
- LastWriteTime of registry key objects referenced in the handle table (_CM_KEY_BODY)
- Embedded registry (filters below)
- Userassist
- Shimcache
- Timers (Timer)
- Symbolic links (Symlink)
You can filter for any of the above options in order to have more focused output using the --type flag:
$ python vol.py -f Win2k12x64-Snapshot3.vmsn --profile=Win2012R2x64 --kdbg=0xf800f17dd9b0 timeliner --type=_CMHIVE
Volatility Foundation Volatility Framework 2.4
1970-01-01 00:00:00 UTC+0000|[_CMHIVE LastWriteTime]| [no name]|
1970-01-01 00:00:00 UTC+0000|[_CMHIVE LastWriteTime]| \REGISTRY\MACHINE\SYSTEM|
2014-06-20 06:31:29 UTC+0000|[_CMHIVE LastWriteTime]| \SystemRoot\System32\Config\SOFTWARE|
2014-06-20 06:31:29 UTC+0000|[_CMHIVE LastWriteTime]| \SystemRoot\System32\Config\DEFAULT|
2014-06-20 06:31:29 UTC+0000|[_CMHIVE LastWriteTime]| \REGISTRY\MACHINE\SAM|
2014-06-20 06:31:05 UTC+0000|[_CMHIVE LastWriteTime]| \??\C:\Users\Administrator\AppData\Local\Microsoft\Windows\UsrClass.dat|
2013-09-15 03:33:22 UTC+0000|[_CMHIVE LastWriteTime]| \SystemRoot\System32\Config\BBI|
2014-06-20 06:31:29 UTC+0000|[_CMHIVE LastWriteTime]| \??\C:\Windows\ServiceProfiles\NetworkService\NTUSER.DAT|
2014-06-20 06:31:29 UTC+0000|[_CMHIVE LastWriteTime]| \REGISTRY\MACHINE\SECURITY|
2014-06-20 06:31:05 UTC+0000|[_CMHIVE LastWriteTime]| \??\C:\Users\Administrator\ntuser.dat|
2014-06-20 06:31:29 UTC+0000|[_CMHIVE LastWriteTime]| \??\C:\Windows\ServiceProfiles\LocalService\NTUSER.DAT|
2014-06-20 06:31:29 UTC+0000|[_CMHIVE LastWriteTime]| \Device\HarddiskVolume1\Boot\BCD|
1970-01-01 00:00:00 UTC+0000|[_CMHIVE LastWriteTime]| \REGISTRY\MACHINE\HARDWARE|
There are three options for output: default text output, bodyfile format and an Excel 2007 file. For more details see Timeliner Release Documentation (pdf) and the OMFW 2011 presentation Time is on My Side. You can also include a machine identifier in the header with the --machine flag (this is useful when combining timelines from multiple machines). The following shows the default text output:
$ python vol.py -f XPSP3x86.vmem timeliner
Volatility Foundation Volatility Framework 2.4
2011-10-13 04:29:21 UTC+0000|[LIVE RESPONSE]| (System time)
2010-08-22 17:38:12 UTC+0000|[IEHISTORY]| explorer.exe->Visited: Administrator@about:Home| PID: 1196/Cache type "URL " at 0x17f5100 End: 2010-08-22 17:38:12 UTC+0000
2010-10-31 13:48:47 UTC+0000|[IEHISTORY]| explorer.exe->Visited: Administrator@file:///C:/Documents%20and%20Settings/Administrator/Desktop/Sparkling_Swiss-4288x2848.jpg| PID: 1196/Cache type "URL " at 0x17f5300 End: 2010-10-31 13:48:47 UTC+0000
2010-10-31 13:49:00 UTC+0000|[IEHISTORY]| explorer.exe->Visited: Administrator@file:///C:/Documents%20and%20Settings/Administrator/My%20Documents/My%20Pictures/Sparkling_Swiss-4288x2848.jpg| PID: 1196/Cache type "URL " at 0x17f6000 End: 2010-10-31 13:49:00 UTC+0000
2011-10-13 04:20:23 UTC+0000|[PROCESS]| wuauclt.exe| PID: 332/PPID: 1032/POffset: 0x0226d580
2011-10-13 04:20:23 UTC+0000|[PROCESS LastTrimTime]| wuauclt.exe| PID: 332/PPID: 1032/POffset: 0x0226d580
2010-10-29 17:08:54 UTC+0000|[Handle (Key)]| MACHINE| wuauclt.exe PID: 332/PPID: 1032/POffset: 0x0226d580
2010-08-22 17:35:38 UTC+0000|[Handle (Key)]| MACHINE\SOFTWARE\MICROSOFT\WINDOWS NT\CURRENTVERSION\DRIVERS32| wuauclt.exe PID: 332/PPID: 1032/POffset: 0x0226d580
2010-08-22 17:35:38 UTC+0000|[Handle (Key)]| MACHINE\SOFTWARE\MICROSOFT\WINDOWS NT\CURRENTVERSION\DRIVERS32| wuauclt.exe PID: 332/PPID: 1032/POffset: 0x0226d580
2010-10-29 16:50:27 UTC+0000|[Handle (Key)]| MACHINE\SOFTWARE\CLASSES| wuauclt.exe PID: 332/PPID: 1032/POffset: 0x0226d580
[snip]
If you don't want to do the extra step of importing, you can use the --output=xlsx option with --output-file=[FILE](OUTPUT) to save directly an Excel 2007 file. Note: You must have OpenPyxl installed for this.
$ python vol.py -f XPSP3x86.vmem timeliner --output=xlsx --output-file=output.xlsx
Another option is to use the --output=body option for TSK 3.x bodyfile format. You can use this output option when you want to combine output from timeliner, mftparser and shellbags.
By default everything except the registry LastWrite timestamps are included in the output of timeliner, this is because obtaining the registry timestamps is quite labor intensive. In order to add them to the output, simply add the --type=Registry option when you run Volatility. You can also limit your focus of registry timestamps by listing a specific registry name (like --hive=SYSTEM) or user (--user=Jim) or both (--hive=UsrClass.dat --user=jim). These options are case insensitive.
$ python vol.py -f win7SP1x86.vmem --profile=Win7SP1x86 timeliner --output=body --output-file=output.body --type=Registry --user=Jim --hive=UsrClass.dat