

Abstract
Offset-driven self-retraction and oscillatory motion of bilayer graphene has been observed experimentally and is potentially relevant for nanoscale technological applications. In a previous article, we showed that friction between laterally offset graphene layers is controlled by roughness and proposed a simple reduced-order model based on density-functional theory (DFT) and molecular dynamics (MD) data, with which predictions on the experimental size-scale could be made. In this article, we extend our study to other layered materials, with emphasis on boron nitride (BN) and molybdenum disulfide (MoS2). Using MD and DFT simulations of these systems and a generalized version of the reduced-order model, we predict that BN will exhibit behavior similar to graphene (heavily-damped oscillation with a decay rate that increases with roughness) and that MoS2 shows no oscillatory behavior even in the absence of roughness. This is attributed to the higher energy barrier for sliding in MoS2 as well as the surface structure. Our generalized reduced-order model provides a guide to predicting and tuning experimental oscillation behavior using a few parameters that can be derived from simulation data.
Export citation and abstract BibTeX RIS
1. Introduction
Two-dimensional materials, such as graphene, boron nitride (BN), and molybdenum disulfide (MoS2), have been at the forefront of scientific interest in recent years. Such materials are promising for a variety of applications due to their unique physical, electrical, and chemical properties [1, 2]. An interesting behavior, recently observed in multilayer graphene, is self-retraction and oscillation [3–5]. These phenomena are observed when the topmost graphene layer is offset laterally relative to those below it; when the layer is released, it slides back, retracting towards its original, overlapping position.
The mechanisms underlying graphene oscillation and self-retraction have been investigated extensively, both experimentally [3–5] and computationally [6–11]. In general, this behavior is explained by the conversion of potential energy of the offset configuration to kinetic energy that drives the system towards its energetically stable overlapping configuration. The dynamics of the motion have been found to be determined by factors that affect the potential energy gradient, including commensurability [7, 10] and temperature [4], and also by factors that affect energy dissipation (or damping) such as surface roughness [11].
All previous work on oscillation and self-retraction has focused on graphene. However, since these phenomena are enabled by the ordered crystallographic layers and the weak interactions between them, it could, in principle, be observable in any material with a similar layered structure. In this article, we explore this possibility by generalizing our previous study [11] to other layered materials. A multi-scale approach, combining molecular dynamics (MD) simulations and density-functional theory (DFT) is employed to investigate the oscillatory motion of laterally offset bilayer graphene, BN, and MoS2, with variable surface roughness. Additionally, simulations are performed with modified inter-layer interaction parameters to study the interplay between surface energetics, surface geometry, friction, and oscillation behavior. We find that, given a small number of parameters that can be obtained computationally, our reduced-order model can be used to predict experimental self-retraction and oscillation behavior for any layered material, as well as the effect that changes in the interlayer contact (stress-induced corrugation, roughness, impurities, etc) may have on these phenomena.
2. Methods
The MD simulations consisted of two square layers of graphene, BN, and MoS2 with side length  , illustrated in figures 1 (a), (c) and (e). The top layer was initially offset relative to the bottom by a distance L = 7 nm. The atoms at the two ends of the layers in the offset direction were treated as rigid bodies. In order to examine the effect of roughness, the root mean square roughness (Rq) of the graphene and BN was varied from 0 to 0.7 Å using the same compression method as in our previous paper [11]. All simulations were performed using the LAMMPS software [12], with a Langevin thermostat applied to maintain a temperature of 300 K.
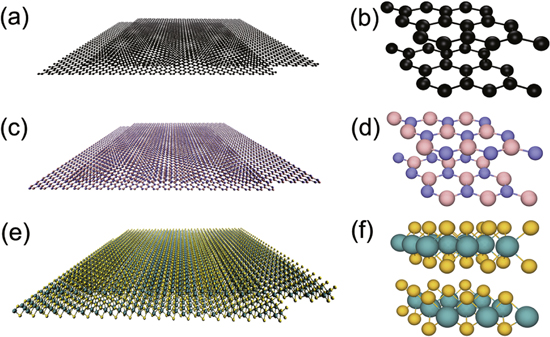
Figure 1. Models of bilayer (a) graphene, (c) BN, and (e) MoS2. The structures of these materials are shown in greater detail in the right-hand panels (b), (d), and (f).
Download figure:
Standard image High-resolution imageThe inter-atomic interactions for graphene, BN and MoS2 were described using the Adaptive Intermolecular Reactive Empirical Bond Order potential [13], the Tersoff potential [14], and the Reactive Empirical Bond Order potential [15], respectively. The long range interactions between layers were modeled using a Lennard–Jones (LJ) potential

where  is the well depth and σ is the inter-atomic distance at which the potential energy crosses zero. The parameters in this model were obtained from references [13, 15–17] and are summarized in table 1. The LJ potential has been widely used to capture interlayer interactions and reproduce physical properties of layered materials. Although the LJ potential may not accurately represent registry dependence [26], it can correctly capture the potential energy barrier and the binding energy [11] which determine the oscillatory motion of graphene [5]. The potential energy barrier for interlayer sliding depends on both and σ, but the equilibrium interlayer distance depends only on σ. Both should affect relative motion between layers. Therefore, additional simulations were performed with the LJ parameters scaled relative to their original values, i.e.
  , with m = 0.5, 1, 1.3, 1.6, 1.8, 2 and 2.2, and
  , with n = 0.5, 1 and 2.
Table 1. LJ parameters used in the MD simulations for all atomic pairs.
| Atom pair |
 (meV) (meV) |
σ (Å) | References |
|---|---|---|---|
| C–C | 2.84 | 3.40 | [13] |
| B–B | 4.116 | 3.45 | [17] |
| N–N | 6.281 | 3.365 | [17] |
| B–N | 5.085 | 3.41 | [17] |
| Mo–Mo | 0.585 | 4.20 | [15, 16] |
| S–S | 20.0 | 3.13 | [15, 16] |
| Mo–S | 2.8 | 3.66 | [15, 16] |
DFT calculations were performed under periodic boundary conditions with the pseudopotentials/plane-waves approach as implemented in the quantum ESPRESSO program [18]. We employed model systems composed of infinite periodic carbon, BN, and MoS2 bilayers separated by sufficient vacuum to avoid self-interactions (illustrated in figures 1 (b), (d) and (f)). The projector augmented wave method was used [19] and the cutoffs were 60 Ry for the energy and 600 Ry for the density in all cases. The  -point grid was 16 × 16 × 1 for the graphene bilayer, and 6 × 6 × 1 for BN and MoS2. In the particular case of MoS2, the sliding potential-energy surfaces were generated by fixing the x and y coordinates of all atoms at the chosen relative layer displacement and relaxing all the coordinates in the direction perpendicular to the bilayer (z). We used the PW86PBE [20, 21] exchange-correlation functional combined with the exchange-hole dipole moment (XDM) model to account for dispersion interactions [22, 23].
3. Results and discussion
3.1. Ideally flat layers
Figures 2(a), (c), and (e) show the two-dimensional potential-energy surfaces for sliding calculated using DFT. The minimum-energy configuration of graphene has the carbon atoms staggered, while the minima for BN and MoS2 correspond to a situation with maximum overlap of unlike atoms: B over N and S over Mo. The binding energies per atom are 24.78 (graphene), 27.68 (BN), and 39.46 (MoS2) meV. The dispersion contributions to these are 31.98, 35.22, and 48.18 meV, respectively, indicating that dispersion interactions are dominant in inter-layer binding. The potential energy surface and the binding energy of BN are similar to graphene, which is no surprise given their similar structures and polarizabilities.

Figure 2. DFT potential energy surfaces for relative layer sliding in bilayer (a) graphene, (c) BN, and (e) MoS2, in meV per unit cell. The atom labels on the color maps represent the bottom layer and the origin of the plot corresponds to the energy minimum. A comparison between the DFT and MD inter-layer interaction energy per unit area in the (111)-direction (i.e. the longer diagonal of the left panels) is also shown for (b) graphene, (d) BN, and (f) MoS2.
Download figure:
Standard image High-resolution imageThe energy per unit area along the long diagonal of the contour plots is shown in figures 2(b), (d), and (f). The maximum energy per area (energy barrier) of MoS2 is more than three times greater than that of graphene or BN. This may be explained by the corrugated nature of the MoS2 surface, which increases both the dispersion binding and the energy barriers, and also by the sulfur anions being more polarizable than the first-row atoms in graphene and BN. Also shown on these figures is the energy per area predicted by the empirical potentials used in the MD simulations. Comparison to the DFT reference data reveals that there is excellent agreement for all three materials, indicating that the MD simulations are able to capture the inter-layer energetics accurately.
MD simulations were first used to characterize the dynamic response of the laterally offset materials for ideally flat layers (i.e. no externally imposed surface roughness). figures 3(a), (b), and (c) show the oscillatory and self-retraction motion of laterally offset graphene, BN and MoS2. The graphene and BN layers exhibit oscillatory motion while MoS2 retracts to the maximally overlapping position without oscillation. Since all three materials are ideally flat, and the commensurability and temperature conditions are the same, the observed difference in the MoS2 dynamics is attributed to the large energy barrier (see figure 2) arising from the corrugated nature of the surface. A higher energy barrier is associated with more resistance to sliding (greater friction), which can in turn be expected to damp the oscillations more quickly. This suggests that self-retraction and oscillation behavior is affected by the inherent resistance of the material to sliding (as measured by the static energy barriers), as well as external factors (e.g. temperature, roughness) as reported previously [4, 11]. While maximizing dispersion binding provides a driving force for self-retraction for all layered materials, small sliding barriers are needed to observe oscillation.
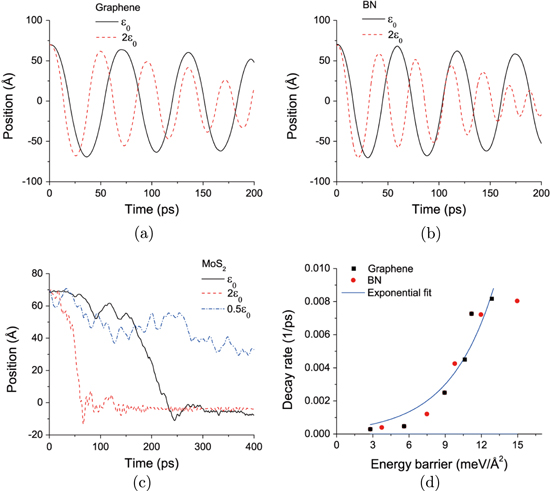
Figure 3. MD-predicted oscillatory and self-retraction motion of laterally offset (a) graphene, (b) BN, and (c) MoS2 with variable energy barriers controlled by changing the LJ parameter . For MoS2 with  the displaced layer does not retract to the initial, maximally overlapping position. (d) Decay rate as a function of energy barrier for graphene and BN; the data is fit to an exponential function
  with prefactor
  and b = 0.2766.
Download figure:
Standard image High-resolution imageTo further analyze the effect of the potential energy barriers on the dynamics, we varied the inter-layer interaction strength by changing the depth of the potential well () in the LJ potential for each material in the MD simulations. The results are shown in figure 3. MoS2 exhibits self-retraction, i.e. the motion is overdamped, for all potential well depths studied. However, for BN and graphene, increasing the interaction strength increases the rate at which the oscillation amplitude decreases over time. This effect is quantified in terms of the decay rate obtained by fitting the maximum position versus time data to an exponential expression. Figure 3(d) shows that the decay rate is faster for stronger interactions, depending exponentially on the barrier.
We also considered the dependence of the motion on the σ parameter. While modifying the LJ parameter changes only the energy barrier, modifying σ affects both the equilibrium inter-layer distance (i.e. the layer corrugation) and the energy barrier. Illustrative results for graphene and MoS2 are shown in figure 4. For MoS2, doubling σ, which increases the interlayer distance, results in the onset of oscillatory motion. The minimum-energy separation between layers becomes larger relative to the intra-layer atomic distances, making the interlayer contact less corrugated. This facilitates sliding because both the energy barrier is smaller and the corrugated nature of the surface impedes the relative motion of the layers, similar to the effect of roughness-induced friction. For graphene, which shows oscillatory motion with the original LJ parameters, we decreased σ by half. As shown in figure 4, instead of oscillating, the upper flake became trapped in a local minimum on the potential-energy surface, which is similar to the behavior seen for MoS2 with 0.5  in figure 3(c). This occurs because, with decreased interlayer distance, the sliding barrier is so high that it cannot be surmounted and the upper layer cannot retract back to the minimum-energy position. Therefore, changing the potential-energy surface can qualitatively alter the self-retraction/oscillation behavior. In particular, a relatively flat (i.e. uncorrugated) surface with low energy barriers seems to be a necessary condition in order to observe oscillation.
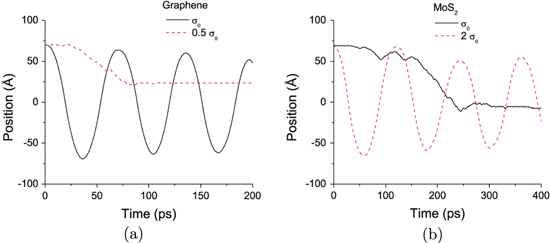
Figure 4. MD-predicted oscillatory and self-retraction motion of laterally offset (a) graphene and (b) MoS2 with variable energy barriers controlled by changing the LJ parameter  . For graphene with
  the displaced layer does not retract to the initial, maximally overlapping position.
Download figure:
Standard image High-resolution image3.2. Roughness and a reduced-order model
Our previous study showed that the decay rate of the oscillatory motion of graphene increases linearly with imposed surface roughness and a reduced-order model was developed to describe that motion [11]. The model is briefly reviewed here. The potential energy, E, as a function of the dimensionless offset ratio  , is written as

The force can be obtained as

and the dynamics can be described by solving equation of motion:

In these expressions, A0 is the area (in this case  ), k1 is the binding energy per contact area, k2 is the amplitude of the oscillatory energy profile, p is the periodicity of the material structure, and c is a coefficient related to the roughness, which controls the friction. Increasing roughness increases friction which, in turn, linearly increases the decay rate of the oscillations [11].
We now examine the effect of increasing roughness on the self-retraction motion of both graphene and BN (since MoS2 does not oscillate even for the ideally flat layers, we do not expect any change in this behavior by increasing the roughness). The results in figure 5 show that graphene and BN each exhibit a linear relationship between decay rate and roughness with similar slopes, but BN has a slightly higher decay rate at zero roughness, likely reflecting the larger energy barrier (figures 2(b), (d)). We also considered the effect of roughness on the decay rate for graphene and BN with the interaction strengths and sliding barriers artificially increased by taking  . The results show that the linear relationship is retained and increasing the interaction strength causes an effectively constant shift in the decay rate to higher values. This suggests that oscillatory motion is affected by both the potential energy barriers (intercept) and the roughness (slope), at least for materials with a structure similar to graphene.
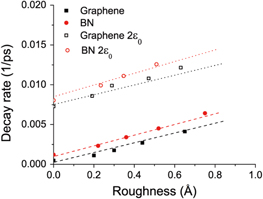
Figure 5. Decay rate as a function of roughness from MD simulations for graphene and BN with the original and artificially increased LJ interaction strength.
Download figure:
Standard image High-resolution imageTo describe these observations, the reduced-order model presented in our previous paper [11] must be generalized. In our previous work, we observed that c depends linearly on the decay rate and then fit the dissipative friction coefficient c using the linear increase in decay rate with roughness predicted by the MD simulations. However, we observe in figure 5 that there is a finite decay rate, even for ideally flat surfaces, which is associated with the surface structure and energy barriers, as discussed in the preceding section. To capture the effects of both roughness and energy barrier on the motion, the definition of the coefficient, c, must be made more flexible. We now propose that this coefficient have the general form

where A and B are determined by the slope and intercept of the decay-rate versus roughness plot (figure 5), and account for the effects of imposed roughness and energy, respectively.
The A and B parameters, as well as k1 and k2, can be obtained from static DFT and MD data. In this work, the surface energy, k1, was obtained from periodic DFT calculations and found to be 0.01888 eV Å−2 (24.78 meV/atom) for graphene and 0.02030 eV Å−2 (27.68 meV/atom) for BN. The value of k2 was calculated as the amplitude of the oscillatory energy profile that results from subtracting a V-shaped curve (given by  ) from the MD potential energy versus the mismatch ratio. From our MD simulations, k2 was calculated to be 2.5 × 10⁻⁴ eV Å−1and 3.2 × 10⁻⁴ eV Å−1 for graphene and BN, respectively.
Table 2 shows the values of A and B obtained from linear fits to the MD data for graphene and BN with original and artificially increased inter-layer interaction strengths. The differences between all values of A (related to the slopes in figure 5) are on the same order as the standard error of the linear fit, indicating that the relationship between imposed roughness and decay rate is nearly independent of the material and sliding energetics. This contrasts with the B parameter that depends strongly on both material and interaction strength, and corresponds to the decay rate for ideally flat surfaces. We showed in figure 3(d) that the decay rate increases exponentially with the energy barrier. Hence, the coefficient c in equation (3) depends linearly on the roughness (with slope A) and exponentially on the energy barrier (through B), and these two effects are independent of each other.
Table 2.
Reduced-order model coefficients A and B for graphene and BN with physical (first row) and artificially increased (2 , second row) interaction strengths.
| Material | Energy barrier | A | B |
|---|---|---|---|
| (meV Å−2) | (eV ps Å−3) | (eV ps Å−2) | |
| Graphene | 5.59 | 0.087 ± 0.007 | 0.003 ± 0.003 |
| 11.18 | 0.109 ± 0.008 | 0.103 ± 0.004 | |
| BN | 7.48 | 0.099 ± 0.006 | 0.014 ± 0.002 |
| 14.96 | 0.126 ± 0.004 | 0.110 ± 0.001 |
The generalized analytical model can, in principle, be used to predict offset-driven motion for any material with any roughness. For example, figure 6 shows the predicted oscillation behavior of graphene and BN with the original and artificially increased interaction strengths, which are consistent with the results obtained from the MD simulations. However, the more useful feature of the model is its ability to predict offset-driven motion for cases where MD simulations are not possible. For example, the roughness that can be imposed in MD is limited by the tractable simulation size and is typically smaller than roughnesses measured experimentally. However, the reduced-order model can be used to extrapolate the behavior of graphene and BN to experimental roughness values in order to predict the self-retraction dynamics of real materials. Figure 6 also shows the oscillation behavior predicted by our model extrapolated to a roughness of 5 Å, which is consistent with the range of experimentally measured roughnesses of graphene [24] and BN [25]. For both BN and graphene, the predicted behavior is oscillatory but heavily damped, with at most one observable oscillation. This result is consistent with the previously-reported experiments on graphene [3–5].

Figure 6. Oscillation behavior of graphene (left) and BN (right) predicted by the reduced-order model with different interaction strengths and roughnesses.
Download figure:
Standard image High-resolution image
Our simple reduced-order model appears to capture the energetics- and roughness-dependent oscillation behavior of BN and graphene accurately. In the case of MoS2, the overdamped behavior of the ideally flat system at any interaction strength (figure 3(c)) prevents calculation of the decay rate and, consequently, the A and B parameters for this material. The value of B is likely one or more orders of magnitude higher than those for graphene and BN. It is important to note that the energy barrier for MoS2 is only three times larger than those of graphene and BN, which means that this is not the only factor contributing to B, and that the layer geometry (and in particular its corrugation, as illustrated in figure 1(f)) also affects this coefficient. Nevertheless, since the decay rate always increases with roughness, we do not expect this material (or others with similarly-corrugated layers) to present oscillation experimentally in any case.
4. Conclusions
Oscillation and self-retraction of laterally offset layers has been observed experimentally for graphene. In a previous article, we explained the oscillatory behavior and its damping mechanisms by inter-layer friction as determined by imposed roughness. Given the potentially relevant technological implications of this phenomenon, in this article, we extend the study to the self-retraction and oscillation behavior of generalized layered materials, particularly graphene, BN and MoS2. A multi-scale approach utilizing DFT, MD simulation, and an extension of our previously-proposed reduced-order one-dimensional model is used.
We predict that flat layers of BN will exhibit heavily-damped oscillatory motion, very similar to that observed for graphene, on the experimental size-scale. For MoS2, only self-retraction motion and no oscillation is predicted due to the inherent roughness (corrugation) of its surface. For graphene and BN, the decay rate of the oscillatory motion is linearly dependent on the imposed surface roughness and increases exponentially with the potential energy barrier for sliding. In general, both relatively-flat surfaces and low potential-energy barriers for sliding are necessary for a layered material to exhibit oscillatory motion.
A generalization of our reduced-order one-dimensional model is proposed that can be applied to quantitatively explain the experimental oscillatory and self-retraction motion of layered materials. The model contains parameters that can be easily derived computationally. Tuning the substrate-dependent roughness of layered materials (e.g. by applied stress, impurities, etc) like graphene and BN, guided by the model, could ultimately be useful in the design of nano-scale oscillators for device applications.
Acknowledgments
The authors thank the US National Science Foundation for its support through grant number 1362565-CMMI and the Spanish Malta/Consolider initiative (no. CSD2007-00045). This work used the Extreme Science and Engineering Discovery Environment (XSEDE), which is supported by National Science Foundation grant number ACI-1053575. AOR thanks Alberta Innovates Technology Futures (AITF) for funding.