Satellites Spy Nearly Quarter-Century of Sea Level Rise
These globes show a visualization of global sea level rise. The data used here, accurate to around 1.6 inches, comes from 23 years of direct NASA satellite measurement of changing ocean surface topography.
Josh Willis, the project scientist for JASON-3, NASA’s next mission to measure sea level rise from space, says what we see here is explainable by a simple fact. “As water heats up it takes up more room. This drives sea level rise,” he says in a recent video. “In addition, as glaciers and ice sheets are melted, extra water is added to the ocean–just like when you turn on your faucet in the bath tub.”
As the data shows, though, the simplicity of the drivers doesn’t mean the results around the planet are simple. Some parts of the ocean are rising faster than other areas, and a few regions are even seeing falling sea level heights. In the Eastern Pacific, for example, sea height dropped over the observation period due to a recurring phenomenon called the Pacific Decadal Oscillation. See the video below.
Related Posts
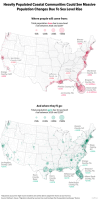
![How many people live within 5 meters of Sea Level?
[[MORE]]by Wufa_01:
I made this map to show the percentage of people in each country who live within 5 meters of sea level.
The science of climate change has some uncertainties, particularly in...](https://64.media.tumblr.com/50ae9a64158e9ad68c01546bd098046d/tumblr_pehtp9nv801rasnq9o1_100.jpg)