About
Dana Lyons' Tumblr
Charts, stats and other market musings from Dana Lyons, partner at J. Lyons Fund Management, Inc., RIA, editor of The Lyons Share and co-founder of My401kPro.com "Long-term investment growth through actively managed risk"
+ FOLLOW THIS TUMBLR
Bearish Fund Assets Hit 3-Year High…AFTER Big Rally

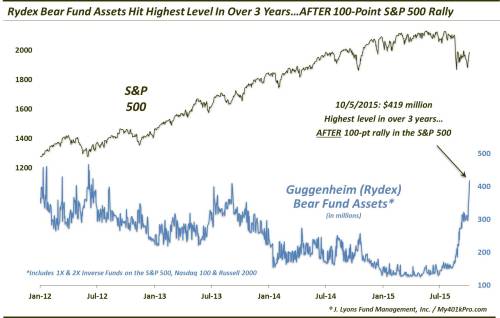
Assets in bearish Rydex mutual funds hit the highest level in over 3 years…AFTER a 100-point rally in the S&P 500.
Using sentiment indicators to guide investment decisions can be a tricky endeavor. First of all, one needs to correctly determine what levels signify “extremes”, from which a contrarian fade can accurately – and profitably – be deployed. Furthermore, over time, one needs to adjust such parameters to account for whatever shifting market dynamics may effect an indicator’s application, including the investment community’s “gaming” of the indicator itself. And even when one thinks they’ve got an accurate handle on what constitutes an extreme in an indicator, sometimes it just continues getting infinitely more extreme.
Sometimes, however, the circumstances surrounding a sentiment indicator at a given time lend themselves to a fairly cut-and-dry interpretation. At the risk of going out on a limb, today’s Chart Of The Day appears to one such bullish example. The ChOTD shows the level of assets in Guggenheim’s (Rydex) bearish mutual funds. These assets are currently (a/o October 5) at the highest level in over 3 years. The odd thing about this milestone is that it comes after a 100-point rally in the S&P 500 (in this case, the Rydex bearish funds consist of the 1X and 2X inverse funds on the S&P 500, Nasdaq 100 and Russell 2000).
I say “odd” because assets and other measures of sentiment typically move in the direction of prices, i.e., as prices rise, investors typically get more bullish, and thus, would presumably reduce their exposure to bearish funds. Not in this case.
After remaining near all-time low levels for most of the year, assets began to flow into Rydex bear funds when the stock selloff accelerated in late August. On the date of the initial correction low, August 25, bear assets rose over $200 million for the first time since October 2014 (see how assets chase prices?). As the market rebounded into mid-September, investors/traders actually increased their positions in these bear funds. To their credit, the market ended up selling off sharply in a retest of the August lows.
However, while these folks did not increase their flows into these bear funds into the selloff, neither did they cover. At the Fed-day high point in the market on September 17, there was $295 million in these bear funds. At the subsequent low, on September 29, there was $297 million.
Since that point, money has poured into these funds…even as the market has enjoyed an epic ripper of a rally. Over the next four days, the S&P 500 gained 103 points (5.5%). Meanwhile, bearish assets rose on each of the four days, from $297 million to $418 million (+40%). While I’d like to give these folks the benefit of the doubt as potential “smart money”, the evidence does not back that up.
First of all, they had very low bearish exposure leading up to the correction, right up until the final, climactic drop in late August. And while they did add to the bearish funds in the mid-September bounce, the fact that they did not cover into the subsequent retest suggests it was more luck than anything else. Now, after adding an additional 40% to their bearish positions over the past 4 days, it is safe to assume these folks are stuck. Having failed to cover at the lows, they have likely doubled or tripled down on their losing positions. Their problem, however, may be that they are fighting a battle that has already been fought.
So what is the interpretation and why is it perhaps “cut-and-dry”? In our view, the interpretation is bullish for stocks. For one, when assets move contrary to price, price typically wins out. The collective investment community as a whole is not traditionally smart enough to out-guess the market.
This is especially true when the group is already at a relative extreme in their allocation before prices move against them. If they react to a price reversal against them by adding to their already extreme (and losing) position, it is an alarm bell for us as outsiders viewing the situation. Adding to their position (in this case, the short side) as price moves against them, increases both their losses and the pressure they are sure to face.
Additionally, the increased bearish assets (ala, short interest) signify stock that will eventually need to be bought back. This can serve as a tailwind for stocks, pushing them even higher and exacerbating the bear fund holders’ losses further. And while the amount of Rydex bear fund assets may not be a significant chunk of the market, if the situation is representative of the broader psychological tone of the market (not a stretch), there could be a lot more in the way of bullish tailwind out there (there is evidence of that). This is the proverbial “wall of worry”.
Speaking of a “small chunk” of the market, this new high in Rydex bearish assets is even more noteworthy considering the substantial decline in overall assets in mutual funds in general, and Rydex funds in particular. Since the rise in popularity of ETF’s about 8 years ago, these mutual fund assets have been on a steady decline. Therefore, to see a 3-year high among the bear assets is fairly surprising – especially into a rally.
FYI, a few other items of note regarding this data:
- The last time Rydex bear fund assets were as high as today was June 19, 2012.
- At $95 million, the combined assets in the 1X and 2X inverse Russell 2000 funds are the highest since June 14, 2012. They are also over three times as high as they were at the low on August 25. Additionally, though this study goes through October 5, the 2X inverse Russell 2000 fund saw its assets double today (October 6).
- At $82 million, the combined assets in the 1X and 2X inverse
Nasdaq 100 funds are the highest since February 4, 2013.
- At $257 million, the combined assets in the 1X and 2X inverse S&P 500 funds are the highest since September 18, 2013 (not a bad short-term short then, btw).
- The only other days since 2007 that Rydex bear assets hit a 12-month high while the S&P 500 was at least 5.6% off of its 1-month low were September 14-16, 2011 and September 16 of this year.
That last bullet point may be the bears’ saving grace as the market did eventually collapse into a retest of the August lows in the 2011 occurrence. Otherwise, while anything can happen in the short-term, this trend of substantially rising Rydex bear assets in the face of a significant market rally would seem to overwhelmingly favor the bulls. In fact, this data point may be the largest feather in the bulls’ cap that we have come across regarding further rally prospects.
_______
More from Dana Lyons, JLFMI and My401kPro.
The commentary included in this blog is provided for informational purposes only. It does not constitute a recommendation to invest in any specific investment product or service. Proper due diligence should be performed before investing in any investment vehicle. There is a risk of loss involved in all investments.