
We Analyzed 13 Billion Opens to Discover Where Subscribers Read Email [Infographic]
The past year has brought many changes to the world of email marketing. Whether it was the replacement of Outlook.com with Office 365, the introduction of the Apple Watch, or a continuous increase in mobile opens, email client market share stats and email opens have seen plenty of shifts.
In our 2015 Email Market Share infographic, we analyze over 13 billion email opens to see where subscribers read emails. We take a look at mobile, webmail, and desktop opens over the course of the year, providing insights about why these changes occurred and how they may affect your email campaigns.
View the 2016 infographic→
To get a full, in-depth picture of all of the major innovations from the past year, check out the 2016 State of Email Report.
-Infographic transcript-
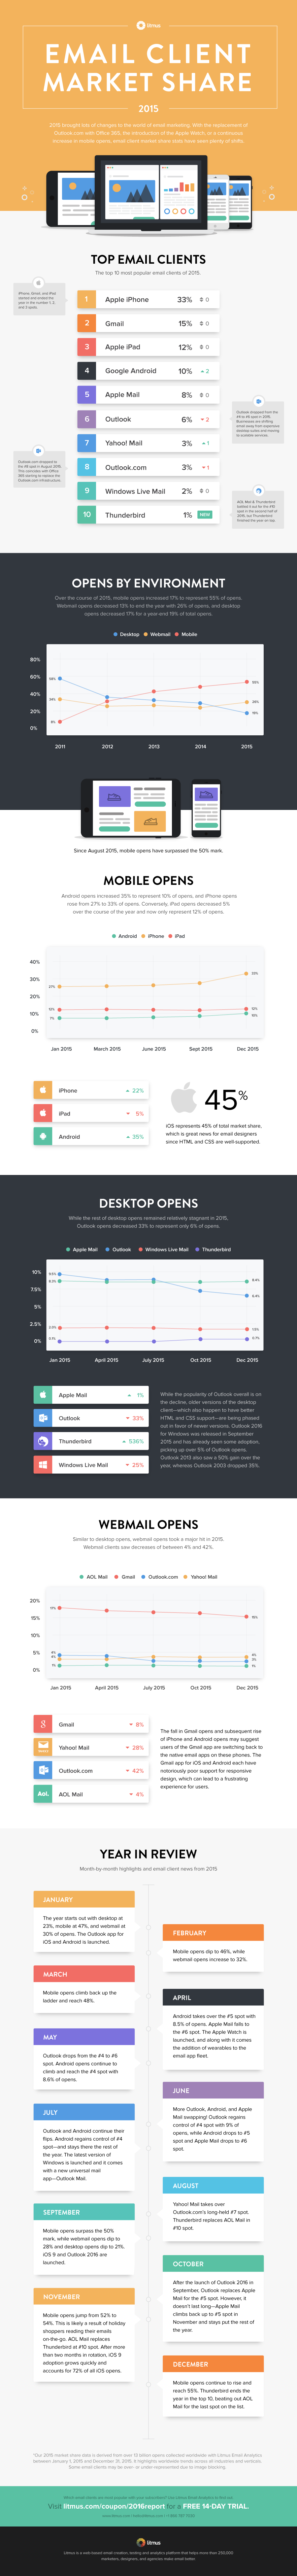
2015 brought lots of changes to the world of email marketing. Whether it was the replacement of Outlook.com with Office 365, the introduction of the Apple Watch, or a continuous increase in mobile opens, email client market share stats have seen plenty of shifts.
TOP EMAIL CLIENTS
The top 10 most popular email clients of 2015.
- Apple iPhone: 33%
- Gmail: 15%
- Apple iPad: 12%
- Google Android: 10%
- Apple Mail: 8%
- Outlook: 6%
- Yahoo! Mail: 3%
- Outlook.com: 3%
- Windows Live Mail: 2%
- Thunderbird: 1%
OPENS BY ENVIRONMENT
Over the course of 2015, mobile opens increased 17% and now represent 55% of opens. Webmail opens decreased 13% to end the year with 26% of opens, and desktop opens decreased 17% for a year-end 19% of total opens.
55% of emails are now opened on mobile. Plus, since August 2015, mobile opens have surpassed the 50% mark.
MOBILE OPENS
Android opens increased 35% to represent 10% of opens, and iPhone opens rose from 27% to 33% of opens. Conversely, iPad opens decreased 5% over the course of the year and now only represent 12% of opens.
- iPhone: Increased 22%
- iPad: Decreased 5%
- Android: Increased 35%
iOS represents 45% of total market share, which is great news for email designers since HTML and CSS are well-supported.
DESKTOP OPENS
While the rest of desktop opens remained relatively stagnant in 2015, Outlook opens decreased 33% and now represent only 6% of opens.
- Apple Mail: Increased 1%
- Outlook: Decreased 33%
- Thunderbird: Increased 536%
- Windows Live Mail: Decreased 25%
While the popularity of Outlook overall is on the decline, older versions of the desktop client—which also happen to have better HTML and CSS support—are being phased out in favor of newer versions. Outlook 2016 for Windows was released in September 2015 and has already seen some adoption, picking up over 5% of Outlook opens. Outlook 2013 also saw a 50% gain over the year, whereas Outlook 2003 dropped 35%.
WEBMAIL OPENS
Similar to desktop opens, webmail opens took a major hit in 2015. Webmail clients saw decreases of between 4% and 42%
- Gmail: Decreased 8%
- Yahoo! Mail: Decreased 28%
- Outlook.com: Decreased 42%
- AOL Mail: Decreased 4%
The fall in Gmail opens and subsequent rise of iPhone and Android opens may suggest users of the Gmail app are switching back to the native email apps on these phones. The Gmail app for iOS and Android each have notoriously poor support for responsive design, which can lead to a frustrating experience for users.
YEAR IN REVIEW
Month-by-month highlights and email client news from 2015
January
The year starts out with desktop at 23%, mobile at 47%, and webmail at 30% of opens. The Outlook app for iOS and Android is launched.
February
Mobile opens dip to 46%, while webmail opens increase to 32%.
March
Mobile opens climb back up the ladder and reach 48%.
April
Android takes over the #5 spot with 8.5% of opens. Apple Mail falls to the #6 spot. The Apple Watch is launched, and along with it comes the addition of wearables to the email app fleet.
May
Outlook drops from the #4 to #6 spot. Android opens continue to climb and reach the #4 spot with 8.6% of opens.
June
More Outlook, Android, and Apple Mail swapping! Outlook regains control of #4 spot with 9% of opens, while Android drops to #5 spot and Apple Mail drops to #6 spot.
July
Outlook and Android continue their flips. Android regains control of #4 spot—and stays there the rest of the year. The latest version of Windows is launched and it comes with a new universal mail app—Outlook Mail.
August
Yahoo! Mail takes over Outlook.com’s long-held #7 spot. Thunderbird replaces AOL Mail in #10 spot.
September
Mobile opens surpass the 50% mark, while webmail opens dip to 28% and desktop opens dip to 21%. iOS 9 and Outlook 2016 are launched.
October
After the launch of Outlook 2016 in September, Outlook replaces Apple Mail for the #5 spot. However, it doesn’t last long—Apple Mail climbs back up to #5 spot in November and stays put the rest of the year.
November
Mobile opens jump from 52% to 54%. This is likely a result of holiday shoppers reading their emails on-the-go. AOL Mail replaces Thunderbird at #10 spot. After more than two months in rotation, iOS 9 adoption grows quickly and accounts for 72% of all iOS opens.
December
Mobile opens continue to rise and reach 55%. Thunderbird ends the year in the top 10, beating out AOL Mail for the last spot on the list.
*Our 2015 market share data is derived from over 13 billion opens collected worldwide with Litmus Email Analytics between January 1, 2015 and December 31, 2015. It highlights worldwide trends across all industries and verticals. Some email clients may be over- or under-represented due to image blocking.
Which email clients are most popular with your audience?
While general email client open data is great for looking at trends, it’s your audience that matters. With the addition of a small tracking code to your campaigns, Litmus Email Analytics generates a report of where your subscribers open your emails. Use that data to focus your testing efforts—and ensure your campaigns look great in inboxes where your subscribers are opening.
Lauren Smith
Lauren Smith is the VP of Acquisition & Lifecycle Marketing at Litmus