In one of the biggest groups of geoscientists in Germany, Austria and Switzerland the question arose how to do a raster comparison in ArcGIS. I’ve already mentioned some aspects of it in a short article with QGIS but let’s take a look on how to do this with ArcGIS and concentrate on the analysis more than on the data.
What we’ll do
We will determine whether two raster files can be treated as “equal” or whether the differences are too big to make such a statistical quote.
What we’ll need
As this analysis depends on data as well as techniques you’ll need something to work with:
- A working version of ArcGIS with the Spatial Analyst Toolbar enabled (check via Customize –> Extensions –> Check Spatial Analyst)
- Two raster datasets (you can download those files according to the original post)
- 7zip or any other unzipper for the example files
The Comparison
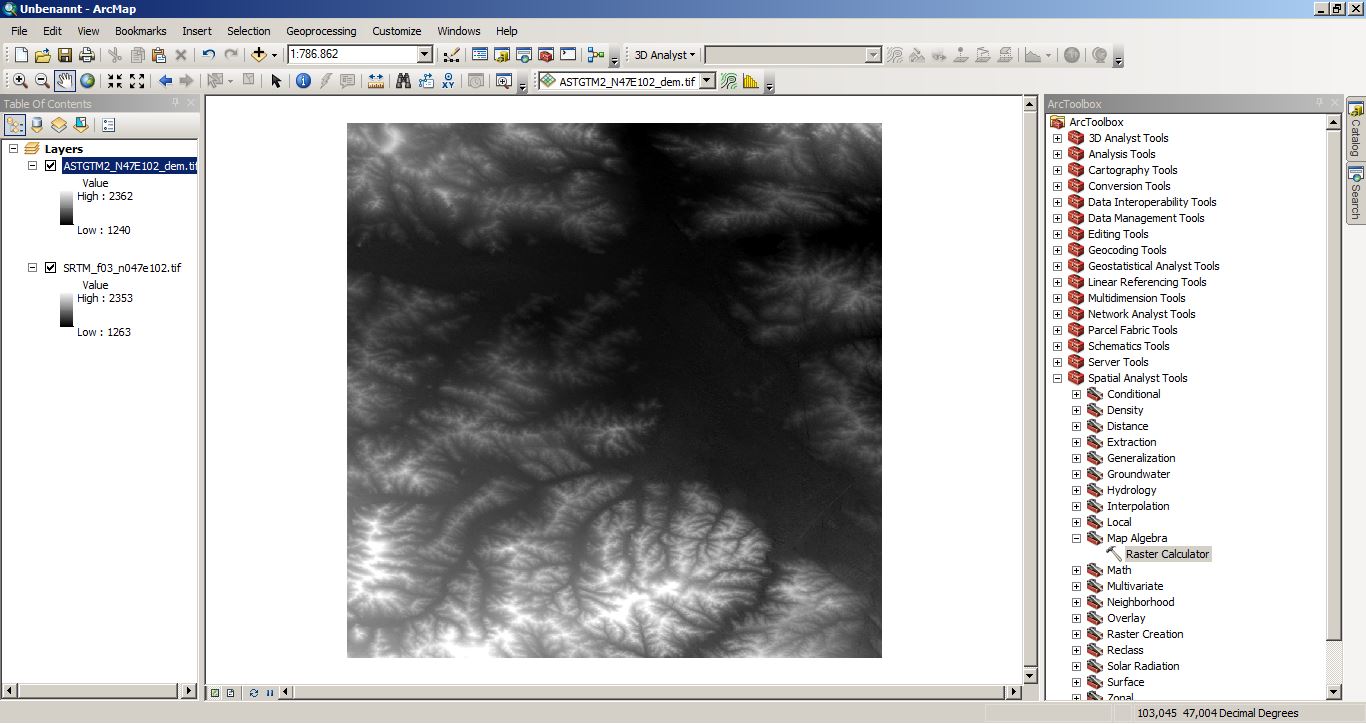
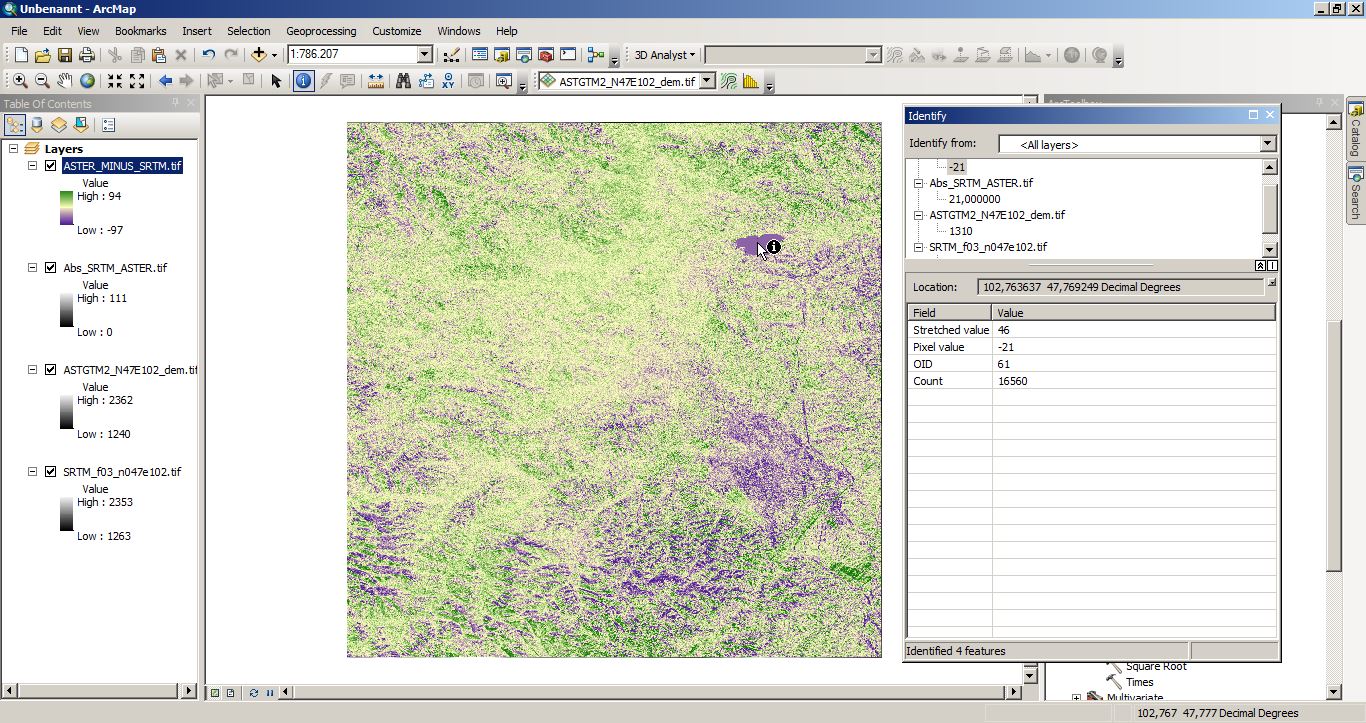
To compare both raster files we will load them initially into ArcGIS by using the Add Data button or by drag and drop of the files. If ArcGIS ask you to build pyramids, you can accept (it makes viewing raster a bit faster …). In my minimal example of SRTM height data vs. ASTER height data from central Mongolia my setup looks like this:
So first step of such an analysis would be a visual or manual comparison just to get a “feeling” for what’s going on. Therefore we are zooming into a location where we can find a lot variance in our height data like a slope-valley situation and use the layer transparency or uncheck the first layer to create something like a manual flicker. A more advanced method is the Image Analysis tool introduced with ArcGIS 10 (Windows –> Image Analysis) which will give you the chance to change transparency of a layer on the fly and create this flickering automatically:
So our assumption is: The raster files are not equal. The differences between them are significant and we assume the ASTER DEM to be of lower quality (which is prob. harder to proof).
Another possibility is to check the differences between both layers. Therefore we will work with the old fashioned Raster Calculator which is included in the Spatial Analyst (Toolbox –> Spatial Analyst –> Map Algebra –> Raster Calculator). The used syntax is quite easy to understand but the usage of the raster calculator might be a little to much “overhead” as you can use the Minus tool in the Spatial Analyst (Toolbox –> Spatial Analyst –> Math –> Minus) as well. But we do have a reason: By difference we mean the absolute differences in both directions. So we first calculate the difference of the raster data, determine the square of this difference and then the square root again:
SQRT [ ( Raster1 -Raster2)² ]
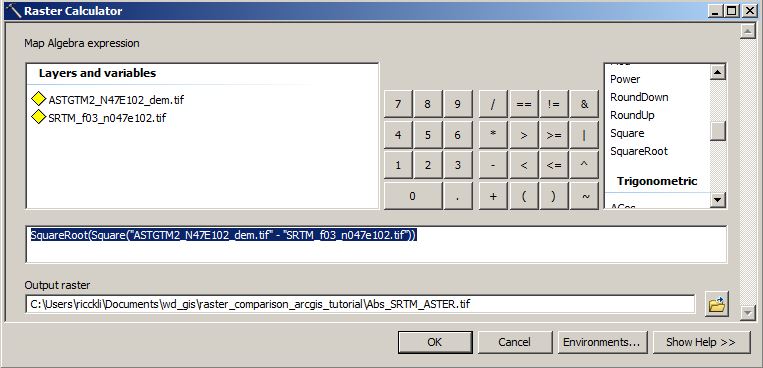
In the raster calculator syntax it looks like this:
SquareRoot(Square(“ASTGTM2_N47E102_dem.tif” – “SRTM_f03_n047e102.tif”))
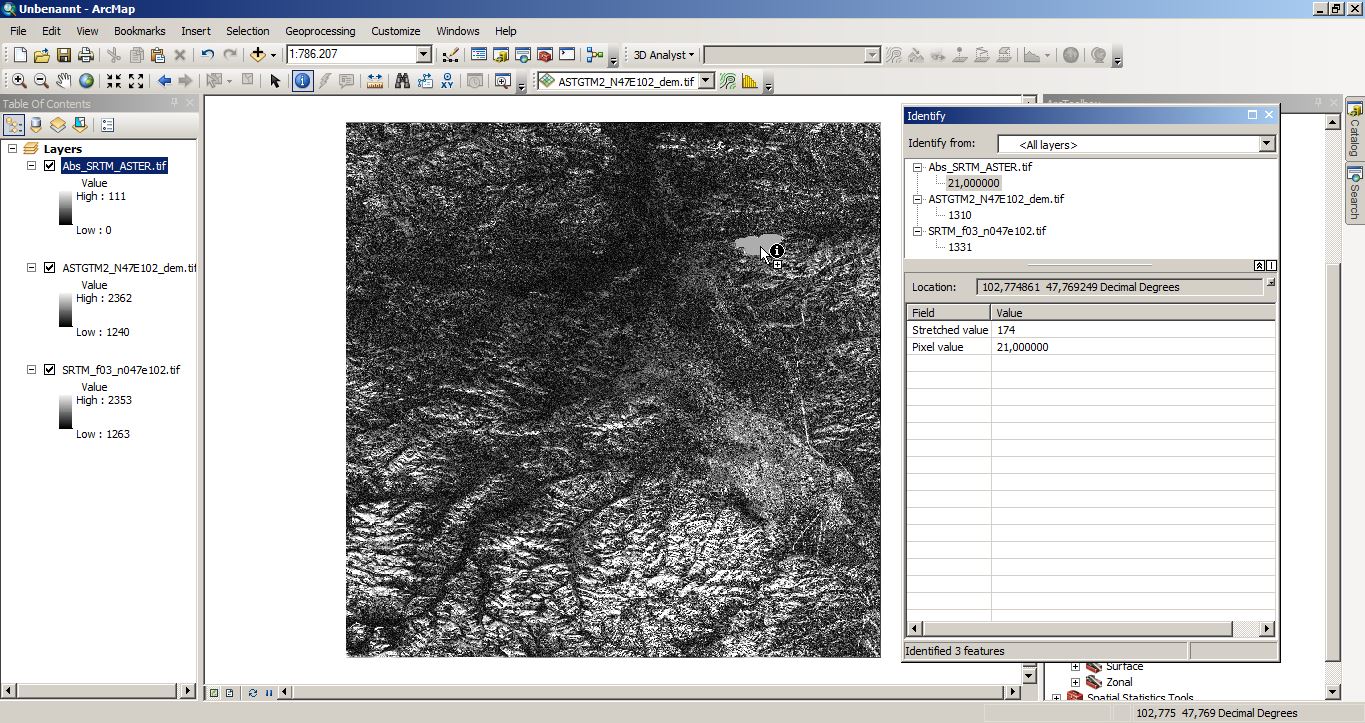
The resulting raster file shows differences up to 111m and especially the lake in the North-Eastern part of the image shows constantly 21m height difference:
Okay our feeling is getting stronger. We have some significant differences… So let’s make the test and the test is: the differences between the ASTER and SRTM DEMs is just random and there is no systematical difference. Therefore we will need the real difference raster so let’s use the Raster Calculator once more or the Minus tool in the toolbox for the lazy guys 😉 :
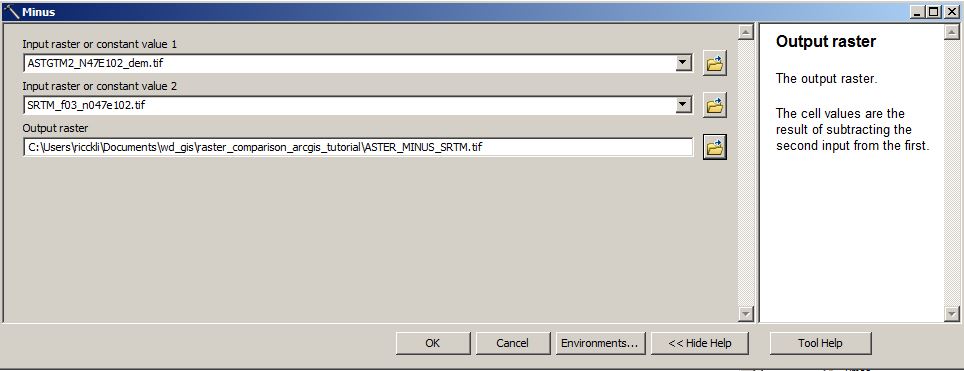
The result should look like this:
But to answer the question whether the differences are random and therefore the mean value of the differences should be zero can be just made by looking into the histogram or checking the statistics in the properties of the resulting raster:

The mean value is near to zero and the standard deviation is about 9m. But it is also possible to say: the mean difference of 5m is systematically and therefore not by chance. So have a look at the histogram:

That looks damn Gaussian…
But we need statistics… Let’s assume that this difference raster is a sample out of a random raster set with mean value of 0 and the same standard deviation. According to Wikipedia we just need to calculate the difference between our sample mean value and null which is quite easy, divide it by the standard deviation and multiply it with the square root of the sample size (which is 1200*1200 pixels):
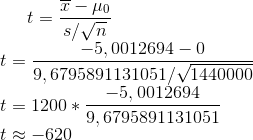
As the t-value needs to be compared against the theoretical t-value of the Student’s tdistribution:
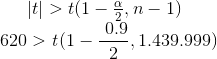
Well according to this source the critical t-value is approx. 1.645 for our level of significance of 90%. We can also increase and state that both raster files are not equal with 99.9% significance.
The Last Question: Which is better
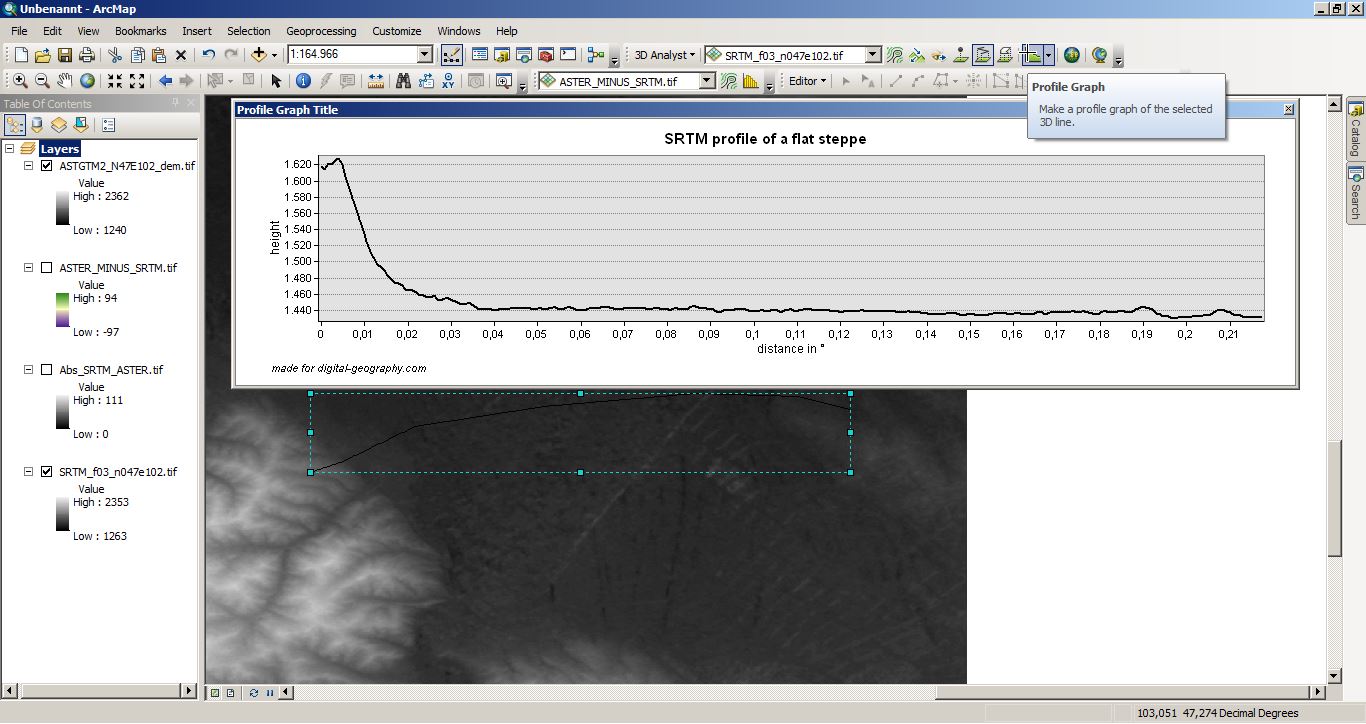
Indeed we are lacking some real world differential GPS measurements or other single points of truth. But we can check the profiles of both raster files along a line with ArcGIS and compare it to our expectation for a flat steppe area:

I hope this helped you and I would love to see some arcpy examples for the Raster Calculator equations i mentioned above. So don’t hesitate and leave a comment.

Hi, I’m trying to follow your same process and everything has worked, but I’m confused by the last step “As the t-value needs to be compared against the theoretical t-value of the Student’s tdistribution” and that math. I have my |t|, a, and n values, but was wondering how you solved for t? Thanks in advance.
Hi, I’m trying to follow your same process and everything has worked, but I’m confused by the last step “As the t-value needs to be compared against the theoretical t-value of the Student’s tdistribution” and that math. I have my |t|, a, and n values, but was wondering what operation the comma separating the two numbers in the parentheses represents? Thanks in advance!